Monday 21 July 2014

TFA Value Ratings

What I intend on doing this Summer is that when people write to me and our discussions sparks off a piece of analysis or an interesting angle to look at, I’ll try to do a blog post on the subject. These posts aren’t going to be too long and ultimately, what I want people to take from these posts is to consider whether or not it’s another angle they may want to look at this Summer.

David wrote to me on Friday with some analysis he’d been looking at on the TFA value ratings. Interestingly, rather than looking at the ratings in terms of value bands as I’d been doing, David was looking at 1% increments and had noticed that there was a clear trend that bets under 1% were terrible value and badly loss making and should be removed from the systems immediately.

I mentioned in the previous post that at times, I can’t see the wood for the trees as there are so many ways to analyse TFA, it’s easy to overlook something fairly obvious.  I think this is another example of me potentially overlooking something that was fairly obvious.

As always, when looking at the data from the algorithms and systems, we need to decide which data to look at. When we are looking at the value ratings, we have a number of options to look at.

All single systems (6,7,8,21,22,31,32,33,41 & 42) from 2010/11 to 2013/14
All live bets from 2010/11 to 2013/14 (6,7,8,21,22 for 4 seasons, 31,32,33 for 3 seasons and 41,42 for 2 seasons)
All bets for rating algorithms only (6,21,31 & 41) from 2010/11 to 2013/14
All live bets for rating algorithms only from 2010/11 to 2013/14 (6,21 for 4 seasons, 31 for 3 seasons and 41 for 2 seasons)

Clearly, we would also like to look at 2013/14 season in isolation and therefore, we have the following two options:

All live bets from 2013/14 season (6,7,8,21,22,31,32,33,41 & 42)
All live bets for rating algorithm only from 2013/14 season (6,21,31 & 41)

I think we have 6 different splits we can look at. Obviously, the bets from the 2013/14 season are the most indicative but as we know, last season was anything but a normal season and therefore, I wouldn’t like to draw too many conclusions from last season’s data in isolation although it will be interesting to see how the results looks.

Rather than analysing tables of data, I am going to use graphs. The vertical graph will be cumulative ROI and the horizontal graph will be the TFA value rating. Clearly, we would expect to see ROI increase as we move along the TFA value axis.

All single systems (6,7,8,21,22,31,32,33,41 & 42) from 2010/11 to 2013/14


As we can see, backing bets with between 0% and 1% value has created a near 17% loss over the 4 seasons of results. Backing all bets up to 5% value is basically break-even which is where my thinking was about missing out these bets this season.

All live bets from 2010/11 to 2013/14 (6,7,8,21,22 for 4 seasons, 31,32,33 for 3 seasons and 41,42 for 2 seasons)


Again, backing bets with between 0% and 1% value has created a near 20% loss for the live systems over the last 4 seasons. Backing all bets up to 9% value is basically break-even.

All bets for rating algorithms only (6,21,31 & 41) from 2010/11 to 2013/14


Again, backing bets with between 0% and 1% value has created a near 175% loss for the live systems over the last 4 seasons. Backing all bets up to 5% value is basically break-even.

All live bets for rating algorithms only from 2010/11 to 2013/14 (6,21 for 4 seasons, 31 for 3 seasons and 41 for 2 seasons)


Again, backing bets with between 0% and 1% value has created a near 16% loss for the live systems over the last 4 seasons. Backing all bets up to 5% value is basically break-even.

All live bets from 2013/14 season (6,7,8,21,22,31,32,33,41 & 42)


Backing bets with between 0% and 1% created a near 16% loss for the systems in the 2013/14 season. Backing all bets up to 16% value is basically break-even.

All live bets for rating algorithm only from 2013/14 season (6,21,31 & 41)


 Backing bets with between 0% and 1% created a near 9% loss for the systems in the 2013/14 season. Backing all bets up to 13% value is basically break-even.

Ok, there is probably a lot to take in here, so let’s try to break it down a little.  In summary:
  •        There is clear correlation between the level of profitability achieved and the TFA value ratings.
  •        The higher the TFA value, the higher the ROI achieved.
  •        It seems a no-brainer to drop all bets of less than 1% value on all algorithms given that for every season, these bets have been badly loss making.
  •       The 2013/14 season was clearly a tougher season than the previous seasons for the ratings and this has been replicated in the value ratings. However, if you had been filtering out the lower value bets, you could have eliminated some of the areas where losses were made.
  •       I would suspect that there is clear correlation between the underlying results for a season and where the value ratings break-even. During a very tough season like last season, if backing all bets, you needed to set the value % fairly high. During easier seasons, your value % could be lower before profits will be made. We won’t know this in advance, so people need to set their value cut-off where it suits them I think.
  •       Clearly, the value ratings provide a filter that appears to be fairly powerful

The ratings were under utilised last season by myself and many other subscribers. Given the issues the systems faced and the fact there was a very easy way to filter out some poor value bets, I’m frustrated by this and from exchanging emails with some subscribers who used the ratings, I’m even more frustrated that these people did much better than everyone else! Basically, during a really difficult season last season, all the info was available to all of us to do much better than we ultimately did and we need to learn from this going forward.

Friday 18 July 2014

Starting later and finishing sooner......

One question that continually crops up in my email box every Summer when I start helping subscribers out with advice for the season ahead is around whether my ratings are as potent at the start of a season and the end of a season.

I remember covering this a few years ago after the second season started horribly in September 2011 but based on the backtested data and live results then, I didn’t think there was anything in it. I remember the same discussion last Summer after the season ended badly in May 2013 and I decided that there were so few bets in May, it is impossible to really draw any conclusions.

Roll on another season and we now have 4 seasons of live results and shock horror, yesterday, someone asked me this very question when they saw the historical results for their portfolio and the fact that September and May were not making any money for their portfolio over the last 4 seasons and therefore, should they consider waiting until a couple of more games are played in each league and stopping the season when there are two games left?

Now, before I share the updated results by calendar month, my own view remains unchanged. I don’t think we can predict when my ratings will work and when they won’t work and the same goes for any subset of bets. A few people are still licking some significant wounds after dropping League Two Aways last season as after all, with losses over the first 3 seasons, surely my ratings had no edge in that league…..wrong!  League Two Aways were the best subset of bets by far last season and a massive correction took place after 3 very poor seasons.

I think the difference between something like League Two Aways poor performance and the poor performance at the start and end of the season is that I had no explanation for the performance of League Two Aways as I admitted. League One Aways were fine, Conference Aways were fine and therefore, it was always a little puzzling that League Two Aways were loss making. I think it’s not too difficult to come up with a theory of why my ratings may not work at the start of the season (after 6 games) and at the end of the season.

Before we start trying to come up with theories, let’s see the updated results of all live system bets since inception of the service (I’ve excluded Under/Over bets as they are no longer part of the service):


 Now, I can imagine people are starting to lick their lips at this picture and will be thinking that they have an extra few weeks off this Summer as they are not starting following the bets until October but I’m not sure it’s as straightforward as this if I’m honest.

I think it maybe helps to look at the breakdown by season first and then come back to the overall results. Here’s the breakdown by season and month:


I always think it’s interesting to look at all TFA results like this as there are so many systems and different types of bets, looking at things at a high level sometimes helps as at times, you can’t see the wood for the trees.

I think the key point from this for me is the fact that every season, there has been a month or two that has been a disaster. In season 1, it was February and April. In season 2, it was September and February. In season 3, it was January and May. In season 4, it was September and March.

So, we have 2 Septembers, 1 January, 2 Februarys,1 March, 1 April and 1 May.  8 shocking months over 4 seasons.

When you look at the overall results for each month above, only September and May have been loss making over the 4 seasons. So, although February had two poor months, it has also had 2 amazing months and therefore, the overall month looks fine!

We can see September has also had an amazing month in Sep-12 but two amazingly bad months in Sep-11 and Sep-13.

May has only really had one shocking month in May-13 but apart from this, May has been OK.

Can we read too much into this?

Lastly, before we try to draw any conclusions, as we know from last season, we can’t ignore the underlying results as at the end of the day, no matter how good or bad my ratings are, they will be impacted by the underlying trends in results.

Here’s the underlying results for the last 4 seasons by month:


I think we have everything we need to start to draw any conclusions.

If I deal with the underlying results first, I think we can see that November is the easiest month of the season for the last 4 seasons based on the underlying results and therefore, it’s no great surprise to see November’s TFA results being so strong.

However, beyond this, it gets difficult to blame the underlying results for the mess we’ve seen with the TFA bets in September and May. September is not an easy month by any means but when you look at January to April, you’d have to say that all 4 months are tougher than September and yet, my ratings cope no bother in these months.

May is a funny month as based on the underlying results and the big Away bias in the month, I’d bet my systems would do great but unfortunately, this isn’t the case. I find this more interesting than September if I’m honest and possibly, there may be something about May which nullifies my ratings to a degree. Again, you wouldn’t need to be a conspiracy theorist to think it’s a motivational thing going on here but again, it’s difficult to be sure.

Overall, I’m not sure the Underlying results are to blame for the issues in either September or May and therefore, I can’t use this as an excuse.

I guess after 2,749 bets in September, it may appear to be the case the ratings have no edge in this month but I think when you know this is based on only 4 seasons of results, it’s difficult to know for certain that no edge exists.

I say this a lot with TFA but it is up to each individual with the service to determine which bets they have and whether or not they decide to start later or stop earlier in the season. I personally will be hoping the systems get off to an amazing start in September and I really hope those who don’t start placing bets then will regret their decision but on the other hand, as long as people have made the decision based on the data and their own thoughts, then no one should worry too much about September results.

I guess deep down, my own issue would be that we can see from the results that the systems have an amazing month 3 or 4 times a season. Hence, if I drop a month, this means that there is a good chance this month may be September or May and therefore, my P&L will be badly impacted for the season. On the other hand, if anyone drops September and it’s a nightmare month, I can guarantee they will have a decent season as if you can dodge a nightmare month, you should have a great season!

Is it worth the risk? IMO, definitely not and having seen these results, I may decide to play smaller stakes nearer the end of the season and I’ll be keeping a very close eye on September to see how it goes this season but I’m not sure I could cope if September 2014 ended up like September 2012 and I didn’t have any bets that month.

What do others think? Are 4 data points enough to draw conclusions about monthly performance? Do people buy into this idea that ratings may not work at the start of the season (I wait 6 games, others wait 8 or 10 games) and therefore, are they happy to sit out the first few weeks of bets?

As always, the above is my view and if September is a nightmare again, please don’t blame me. I give you the data and results, it’s up to all of you to determine what you do with it…….

Thursday 17 July 2014

Review of SBC TFA Portfolios

For those reading the blog or subscribing to the service that are not Secret Betting Club (SBC) members, one of the things I did last season was construct 10 example portfolios of TFA bets that I tracked every month in the SBC forum. The main reason for doing this was that I wanted to highlight to SBC forum readers that:

  •         TFA provides subscribers with the ability to achieve a decent level of return on capital from the service due to the sheer number of systems available to follow
  •        Constructing a TFA portfolio isn’t that difficult and anyone can do it
  •        Turnover is much more important than ROI when it comes to achieving a decent return on capital for a betting portfolio
  •        Lastly, I hoped to be able to demonstrate that no matter how you followed the service last season, you should have been able to make a profit 

Of course, as regular blog readers will be aware, last season didn’t exactly go to plan for TFA and for the first season since inception, some systems had a losing season. This had a knock-on effect on these portfolios and therefore, for the low turnover portfolios, the season was a real struggle.

The purpose of this post is to provide a quick overview of how the season went generally for the portfolios and for the first time, to share which systems were part of each portfolio. I didn’t share the systems which made up the portfolios with the SBC forum members although of course, I shared the systems with Peter Ling of the SBC. The purpose of the forum thread wasn’t to get people to follow the bets, it was to show how powerful (or not!) a portfolio approach could be with TFA.

There has been a lot of talk last season on this blog and other blogs about whether or not a portfolio approach is an appropriate way to follow the TFA systems. I’ve always made my feelings well known on the subject and for me personally, this is the way that I like to follow the systems.  For me, the 3 main benefits of a portfolio approach are:

  •      Diversification – You are not putting all your eggs in one basket by following one system, one algorithm or one type of bets
  •      Leverage – You can make your betting bank work harder for you. For example, a system may need a 50pt bank and yet, 3 systems combined may need a 100pt bank.
  •      Increased Returns – This is linked to leverage I think but if you are following multiple systems from a combined betting bank, there is potential to increase your return on capital

I think after the first 3 seasons following the systems this way, I honestly believed that if you followed a decent number of systems in a portfolio, you couldn’t lose following TFA. Of course, this was based on the premise that every system would be profitable every season and the more bets you followed, the more money you made and therefore, TFA was the greatest thing since sliced bread.

Roll on 12 months and not surprisingly, my views are not as strong as they were last Summer. I still believe TFA to be the greatest thing since sliced bread but I now appreciate that a losing season for a system is not as remote a possibility as I thought previously. Therefore, if a system can have a losing season, a portfolio with a number of losing systems can have a losing season and therefore, the TFA portfolio approach is not as infallible as I thought it was.

However, I do think if you follow some basic rules about building a portfolio, it is still a decent method but like any betting method, if you don’t put enough thought into it or don’t appreciate the risks fully, it can go wrong.

OK, so here are the overall results for the season for the 10 portfolios I tracked in the SBC forum last season:


I think the first point to make is that only 7 of the 10 portfolios managed to make a positive return last season. This alone is disappointing to me but I think when you see which portfolios lost money, we can probably learn from this experience.  The 3 lowest turnover portfolios lost money last season as quite simply, they didn’t have enough bets. If you rely on 3 systems, you aren’t actually getting that much diversification at all and as I’ll discuss below when I look at each portfolio in more detail, there was not enough diversification in these lower turnover portfolios at all. Hence, they were probably not much better than just following a single system and as I said above, a single system can make a loss over a season.
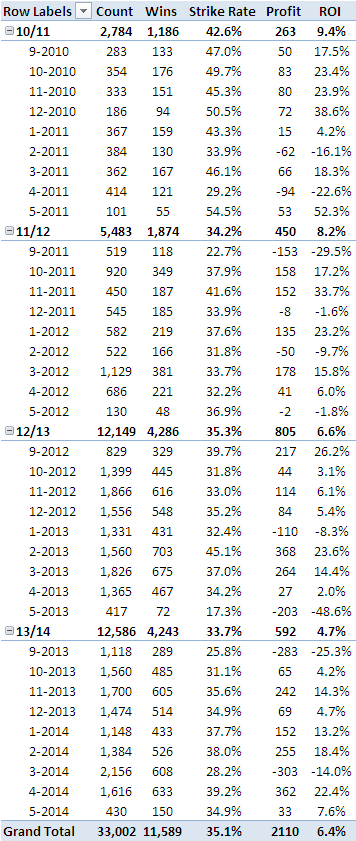
I think the other thing that jumps off the page here is the months of Sep-13 and Mar-14. Anyone following the blog last season as well as those following the system bets themselves will be aware of the difficulties the systems had in both these months generally as the underlying results were very tough and we can see that impact magnified to a degree here as we’re looking at combinations of systems. Obviously, both of these months were a bit of a nightmare but I think it’s interesting that even during a really poor season for the systems and a tough season generally for football betting, 7 of the portfolios achieved a profit.

I guess the other point I’d make is that even though 3 portfolios lost money, the losses were very small. The worst system lost 11.2% of its betting bank over the season. The lowest ROC for a profitable portfolio was 25.9%. The average ROC for a losing portfolio was 8%, the average ROC for a winning portfolio was 59.6%.

I think the other point worth making is the ROI. I came up with the phrase a few years ago ‘ROI for show, ROC for dough’ and I think we can again see this in play here. Portfolio 1 managed to make an ROI of 5.3% which for some people, may not seem like a decent ROI for football systems but when you see this is achieved across 2,157 bets, it suddenly doesn’t appear too bad as the ROC is 91.6%.  A bank growth of 91.6% for a really poor season and the worst season of the 4 so far doesn’t look too bad now does it?

OK, I’ll quickly run through each portfolio and comment on the individual system results in each portfolio and the overall returns for the portfolio.

Portfolio 1

This portfolio contains 7 systems and the portfolio is fairly well diversified. It contains 3 Est Systems (21,7-21 and 8-22), 1 New System (31), 1 Misc System (STOY), 1 Draw System (D1-D6) and 1 Euro System (E2-E7). 

With hindsight, I’m not sure what system 7-21 and 8-22 bring to the portfolio apart from extra correlation as the bets will already appear on system 21. I would probably throw in a European Draw system next season and remove 7-21 and 8-22 if I was adjusting this portfolio next season.

In terms of results, here’s the results by system:

21  = 11.9pts
7-21 = -16.8pts
8-22 = -9.1pts
31 = 56.9pts
STOY = 21.4pts
D1-D6 = 44pts
E2-E7 = 6.2pts

Overall, a profit of 114.5pts, an ROI of 5.3% and a ROC of 91.6%.

On one hand, I’m disappointed with the results as based on historical results, I would have expected a higher level of ROC. However, considering how tough the season was and the fact this is the toughest of the 4 seasons to date, I don’t think I can moan too much about the level of returns. With hindsight, I’m not even sure what systems 7-21 and 8-22 are doing in the portfolio as they don’t bring any additional diversification and as luck would have it, these two systems are the ones pulling down the performance of the portfolio.

Portfolio 2

This portfolio contains 7 systems and the portfolio is again fairly well diversified. It contains 3 Est Systems (21,6-21 and 7-22), 1 New System (31-41), 1 Misc System (STOZ), 1 Draw System (D2-D6) and 1 Euro System (E2-E6). 

Similar comments to portfolio 1 really as I’m not sure why we need 6-21 and 7-22 in the portfolio. I would keep either 21 or 6-21 and bring in a new European Draw system to replace the lost turnover.

Here’s the results by system:

21  = 11.9pts
6-21 = 12pts
7-22 = -11pts
31-41 = 41.9pts
STOZ = 8.8pts
D2-D6 = 36.3pts
E2-E6 = 13.9pts

Overall, a profit of 113.9pts, an ROI of 5% and a ROC of 75.9%.

Only the one losing system in this portfolio and again, it is probably one system that shouldn’t even be in there. I think a few key systems in here had a below par season (21 and STOZ) and during a more normal season, the returns would have been better I think. Even so, a 75.9% ROC is not too bad during a really tough season.

Portfolio 3

This portfolio contains 7 systems and the portfolio is again fairly well diversified although there were no Euro bets in this portfolio. It contains 2 Est Systems (6-21 and 8-22), 2 New Systems (31,33-41), 2 Misc Systems (STOY, TOX), 1 Draw System (D3-D7).

With hindsight, I would replace either STOY or TOX with another Misc System (6-32 probably) or replace it with a Euro system. I would also bring in a Euro Draw system. 

Here’s the results by system:

6-21 = 12pts
8-22 = -9.1pts
31 = 56.9pts
33-41 = -10.1pts
STOY = 21.4pts
TOX = 11.5pts
D3-D7 = 1.7pts

Overall, a profit of 84.5pts, an ROI of 4.4% and a ROC of 56.3%.

2 losing systems, a poor selection of a draw system and an under performance of 6-21 and TOX and yet, the portfolio made 56.3% ROC. I think this is as good an advert for a portfolio approach as you can get! Lots of mistakes made in the selection of the systems but at the end of the day, we will never choose the correct systems. I think with a portfolio approach though, you can limit the damage by having more systems in there or in the case of this portfolio, you can actually still achieve a good return during a horrible season!

I would probably remove STOY or TOX and include a Euro System and maybe throw in a Euro Draw system too.

Portfolio 4

This portfolio contains 6 systems and the portfolio is less well diversified as there are no Draw or Euro bets included. It contains 2 Est Systems (6-21 and 8-22), 1 New System (31-41) and 3 Misc System (STOY, STOZ and 6-21-31)

My thinking when I built this portfolio was to concentrate solely on the UK bets and put an emphasis on the Misc systems. The first 3 portfolios had more emphasis on the Est and New Systems. Looking at it again, I would probably only keep STOY or STOZ and of course, with no Euro or Draw bets, there is plenty of room for more diversification and turnover if wanted.

Here’s the results:

6-21 = 12pts
8-22 = -9.1pts
31-41 = 41.9pts
STOY = 21.4pts
STOZ = 8.8pts
6-21-31 = 25.4pts

Overall, 100.4pts profit, an ROI of 4.7% and a ROC of 66.9%.

Only one losing system in here but it’s a fairly strong performance from this portfolio. With hindsight, having STOX and STOY in there probably doesn’t make sense and with hindsight, having seen the returns of the top 3 portfolios, I’m definitely favouring the route of more diversification across other bets (Draws and Euros) but for a UK specific portfolio, this one isn’t too bad.

Portfolio 5

This portfolio contains 6 systems and the portfolio is slightly more diversified than portfolio 4 but there are no Euro bets included. It contains 2 Est Systems (21 and 7-21), 1 New System (31-42 and 33-42), 1 Misc System (STOZ) and 1 Draw system (D2-D7)

This is the first portfolio with a much lower turnover as some of the systems are getting to be more selective. Again, it’s easy with hindsight to say I’d change systems but I think for the purpose, this portfolio is OK.

Here’s the results:

21 = 11.9pts
7-21 = -16.8pts
31-42 = 4.2pts
33-42 = -9pts
STOZ =  8.8pts
D2-D7 = 39.8pts

Overall, 38.9pts profit, an ROI of 2.6% and a ROC of 25.9%.

With 2 losing systems, 2 systems which performed poorly and one system below par, it’s amazing any profit was made at all here, never mind a 25.9% ROC! You make your own luck at times and I guess by including an unproven Draw system in here, this made this portfolio last season. All of the profits came from the Draw system which going into the season, had no live results!

A really poor performance from this portfolio but if this can happen during a poor season, it can only get better I suspect!

Portfolio 6

This portfolio only contained 5 systems but I would say it was fully diversified unlike a few of the previous portfolios. It contains 1 Est System (6-21), 1 New System (31-42), 1 Misc System (STOY), 1 Draw System (D2-D6) and 1 Euro System (E3-E7).

I like this portfolio. I liked the idea of one system from each group of systems although I’d probably switch 31-42 for 31-41 and I’d probably switch the draw system to D1-D6 and bring in a new Euro Draw system too in future.

Here’s the results:

6-21 = 12pts
31-42 = 4.2pts
STOY = 21.4pts
D2-D6 = 36.3pts
E3-E7 = 5.1pts

Overall, 79.1pts profit, 6.3% ROI and a ROC of 63.3%.

I like this portfolio idea. I like the way the risk is spread evenly across all systems although as always, it is probably taking a bit of a chance with putting equal weight on the Euro and Draw systems given their lack of live bets thus far but again, it worked out fine.

Portfolio 7

This portfolio only contained 5 systems and it was fairly well diversified (No Euro Systems) although we are now into the portfolios that had lower turnover. It contains 1 Est System (6-21), 1 New System (32-41), 2 Misc Systems (21-31, STOZ) and 1 Draw System (D3-D7).

Here’s the results:

6-21 = 12pts
32-41 = -0.7pts
21-31 = 24.4pts
STOZ = 8.8pts
D3-D7 = 1.7pts

Overall, 46.3pts profit, 3.1% ROI and a ROC of 37%.

This portfolio struggled a little with system choice. 32-41 rather than 31-41 dented profits massively, D3-D7 rather than of the other first 4 combined draw systems (D1-D6 thru to D2-D7) dented profits massively and STOZ was poor in comparison to TOX and STOY.

Again though, difficult to be too critical of a portfolio that makes 37% ROC during a really poor season for the systems in general.

Portfolio 8

This portfolio only contained 4 systems and 3 of the systems were more of the selective systems amongst the combined systems. Hence, given the issues we had with filtering the system bets, these portfolios are going to struggle last season.

The 4 systems were 1 Est System (7-21), 1 New System (33-41), 1 Misc System (STOY) and 1 Draw System (D3-D7)

The results were:

7-21 = -16.8pts
33-41 = -10.1pts
STOY = 21.4pts
D3-D7 = 1.7pts

Overall, -3.8pts, -0.7% ROI and -4.8% ROC.

When 50% of the portfolio contains the worst Est System and the worst New System (not easy to do considering there were 66 possible pairs of these systems!), it is unlikely to be a good season!

With hindsight, following a lower number of systems in a portfolio isn’t the worst idea in the world but following very selective systems in a portfolio opens up the door to variance as you don’t have enough turnover to overcome the variance.

My own view is that if you are following a portfolio approach, you need to ensure you have enough unique bets to make it worthwhile. This portfolio along with the other two losing portfolios didn’t have enough bets last season IMO.

Portfolio 9

This portfolio only contained 3 systems these were more of the selective systems amongst the combined systems. Hence, given the issues we had with filtering the system bets, these portfolios are going to struggle last season.

The systems were 1 Est System (7-21), 1 New System (32-42) and 1 Misc System (TOX).

The results were:

7-21 = -16.8pts
32-42 = -2.7pts
TOX = 11.5pts

Overall, -8pts, -1.3% ROI and -8% ROC.

Again, when 2/3 of the portfolio contain losing systems, you can’t expect to have a winning season! Not enough bets and not enough systems.

Portfolio 10

This portfolio only contained 3 systems these were more of the selective systems amongst the combined systems. Hence, given the issues we had with filtering the system bets, these portfolios are going to struggle last season.

The systems were 1 Est System (7-22), 1 New System (33-42) and 1 Misc System (STOZ).

The results were:

7-22 = -11pts
33-42 = -9pts
STOZ = 8.8pts

Overall, -11.2pts, -2.2% ROI and -11.2% ROC.

I think after writing the above reviews, there are some additional points I would add when building a portfolio approach to following the TFA systems:
  •         Think about what each system brings to your portfolio. Don’t just add systems for the sake of adding systems. If it doesn’t bring you diversification, leverage or increased returns, don’t add the system!
  •         Following 3 or 4 correlated systems in a portfolio with a very low overall turnover of unique bets is not a portfolio approach at all and is no better than following one system (and is probably worse!)
  •         To benefit from a portfolio approach, you need to follow a decent number of systems and of course, the more diversification you have, the better
Hopefully this post gives a good case for following a portfolio approach to TFA but as always, if used incorrectly, it can go badly wrong I think! 

Monday 14 July 2014

Notes from refreshing the rating algorithms.......

The purpose of this post is a whistle stop tour of the work I’ve been doing over the Summer to refresh the ratings with updated data and hopefully improve on the results from the last 4 seasons. As discussed in the previous post, it has definitely been a case of refreshing what I already had and not rebuilding ratings and therefore, if everything goes wrong next season, it won’t be due to changes I’ve made this Summer! I think my one concern with refreshing my ratings has been the fact that it invalidates the live results of the ratings but having spent time looking at the ratings and looking at what others do in the market, refreshing ratings is common place and therefore, I’m not concerned.

I have shown over the last 4 seasons that I am able to build new ratings from scratch and ensure the rating algorithm makes a profit each season. Refreshing ratings by tweaking some rating weights based on updated data isn’t going to suddenly mean that my ratings turn bad overnight and of course, bringing in more recent data allows me to refine the algorithm somewhat and hopefully make it much more current than what I was using previously.

I’ve made some notes as I was going through the work for this and I’ll share these below. Of course, the notes mean more to me than all of you but in the interests of transparency, I’m happy to share them on the blog. People can ask questions if they like but I’m not going into any great detail about the impacts on results as quite simply, I don’t want to get bogged down. The odds I’ve used in the work to refresh the ratings are not the same odds I’ve quoted for the bets when the ratings were live and therefore, I’d be comparing chalk and cheese. What I would say is that I wouldn’t make any changes to any ratings or weightings without working through the consequences on all live results to date and obviously, I wouldn’t make changes unless it improved the results of the ratings and the systems.

I would say that these ratings are now in the best state they’ve been in since the first season they went live. Given the first live season is usually the most potent for my ratings, I’m really confident and excited that next season, we’ll reap the rewards of the work I’ve been doing this Summer.

I’ll quickly discuss some generic changes I’ve made before looking at each algorithm in detail

Removal of the minimum odds stipulation on some rating algorithms for Home teams – Quite simply, I was never too comfortable playing in the area of very short odds on Home teams as historically, I was finding it very hard to make 10%+ return from this subgroup of bets. What I found through when I was refreshing the ratings was that this subgroup had made a profit overall based on the last 4 seasons of results and therefore, I was missing out a potentially lucrative subset of bets. Last season was an amazing season for this group of bets but even before that, 2 of the previous 3 seasons had made a profit. This was a simple change to make although it is a very selective change and only applies to some underlying systems.

Removal of the minimum odds stipulation on same rating algorithms for Away teams – Same comment as above really and I was never comfortable playing short priced away bets. This was less clear cut than the Home bets though but basically, I think there are better ways for my ratings to filter out the poor value low odds away bets than just me applying an across the board exclusion. This does vary by rating algorithm though, so I’ll make it clear which algorithms are impacted.

Increased volume of Home bets on every algorithm – Quite simply, due to the fact my rating algorithms were traditionally built on data from 2000-2009, there was a clear bias towards Away teams. This made its way into my ratings where around 70% of bets were Away teams and 30% were Home bets. By flushing through more recent data (especially last season), the bias has reduced somewhat and we will see more Home bets next season on every algorithm. Away teams will still make up the vast majority of bets though and given their higher long-term expected returns, I’m comfortable with this.

Over estimation of Home bias in my rating factors – Again, this is sort of linked to the previous point but my models were putting too much weight on how teams played at Home and this then meant when they played away from home, the expectation was they could produce similar performances. Hence, my models favoured Away teams who were strong at home when in reality, this wasn’t coming through in the results. Based on the last 4 seasons of results, by reversing this factor, it turned the factor from a losing factor (backing all bets was losing when compared to no adjustment) to a winning factor (adjusting for this negatively improved the returns). As always, not sure I really understand why this pattern changed from the early 2000s to the recent years. I suspect it’s simply the case that weaker teams find it more difficult to perform away at better teams than historically. The market knows this, my model didn’t!

Over estimation of long-term form – By long-term form, I mean performance in the last 6,8 and 10 games. My model uses a rating factor for all 3 and what I found was that by reducing the weightings on these factors, it increased the returns. Again, seems a more recent phenomenon based on my dataset but should see an improvement next season.

Under estimation of recent form – By recent, I mean the last game played. I think I fell into the trap of thinking that recent game form wasn’t a good indicator of future performance and that in all likelihood, the market would have this rating factor sewn up but as I’ve found out this Summer, this is definitely not the case. Only makes a very small difference overall but when used in conjunction with some of my other rating factors, I thought the results were much better than I anticipated.

More appreciation of the favourite-longshot bias – When building my ratings years ago, I had it in my head that backing short-prices was a losing strategy long-term whereas betting outsiders was much better as clearly, you get much better value on outsiders don’t you? Well, as I’ve found over the last few seasons, if simply backing all favourites, you can’t lose that much money long-term whereas if you back all outsiders, you will lose badly! Hence, although there are much better returns to be found backing outsiders, it’s a riskier place to play and therefore, ignoring all value bets at short-odds is not the right thing to do! I had lots of filters on systems to ensure that as I filtered the bets, I excluded those at short-prices which ensure the ROI increased as I filtered bets out. This is a flawed strategy I think and as I saw last season, the Home bets that made it through to the higher combined systems were rubbish whereas all the nice value bets at shorter odds did well on the systems. Some of these filters have been removed where I could see I had depressed the profits over the last 4 seasons.

I think that covers off the generic changes I’ve been making. Some were specific things I went looking for, others were things that jumped out as I refreshed the data and started moving the rating weights up and down. Some were surprising, some were obvious with hindsight but overall, I’m much more comfortable with where the algorithms are now.

Algorithm 1 (systems 6-8)

  •          Removed the Home odds filter on one of the underlying systems. This will see a handful of Home bets appear on system 6 at very short odds (1.10+) but they can’t appear on systems 7 or 8.
  •          Removed the Away odds filter on one of the underlying systems. This will see a handful of Away bets appear on system 6 at short odds (2.30+). Again, they can’t appear on system 7 or 8.
  •          Refreshing the ratings has saw an increased number of Home bets relative to Away bets than previously. Over the 4 live seasons, split moves from 62/38 in favour of Aways to 59/41 in favour of Aways.
  •          Reduction in average odds from 3.16 to around 3.00 which is a consequence of the above movements
  •          Weightings shifted slightly on all 16 rating factors but nothing significant to note.
  •          Overall, turnover should be increased slightly but as always, moving from backtested turnover to live turnover isn’t always as easy as you think. Historically, I’ve tended to see reduced turnover when systems have gone live compared to what I expected.

I’ve done a quick and dirty analysis of the games that would have appeared on system 6 last season based on the old algorithm compared to the games appearing under the new algorithm.

Homes – Profitability increased from 4% ROI to 9% ROI and turnover is up 60%
Aways – Profitability increased from 2% ROI to 8% ROI and turnover is down 20%

This analysis is not perfect as the odds quoting isn’t the same in both datasets, so there will be flaws in this analysis. In addition, the ROI under the new rating algorithm will always be better than what I achieved last season, the same way it tends to be better during backtesting I think. Some of the bets that make its way onto the new algorithm wouldn’t have been bets on a Thursday evening when I gave the bets and interestingly, I can see a handful of teams where the odds have swung so much from the Thursday evening, we’d be on the opposing team in the updated dataset!

If people want to follow pretty much the same algorithm as last season, I suggest they don’t back any Home bets below 1.75 or any Away bets below 2.75.

I haven’t done any analysis at all on TFA value ratings and therefore, assumptions will need to be made that the bets that are different hasn’t changed the picture too dramatically with these value ratings. Given I suspect the vast majority of the bets that have changed is where value is less than 5% (I assume this to be the case but may not be), then I don’t think it should impact the value ratings at all in terms of the higher bands.

Algorithm 2 (systems 21-22)

  • Removed the Home odds filter on one of the underlying systems. This will see a handful of Home bets appear on system 21 at very short odds (1.10+) but they can’t appear on system 22.
  • Removed the Away odds filter on 3 of the underlying systems. This will see a decent number of Away bets appear on systems 21 and 22 at short odds (1.80+).
  • Mix between Home and Away bets remains unchanged from previous rating algorithm.
  • Slight reduction in average odds by around 0.2pts (3.4 to 3.2)
  • Weightings shifted slightly on all 16 rating factors but nothing significant to note.
  • Overall, turnover will be increased slightly but always, moving from backtested turnover to live turnover isn’t always as easy as you think. Historically, I’ve tended to see reduced turnover when systems have gone live compared to what I expected. 
I’ve done a quick and dirty analysis of the games that would have appeared on system 21 last season based on the old algorithm compared to the games appearing under the new algorithm.

Homes – Profitability increased from -9% ROI to 6% ROI and turnover is up 100%
Aways – Profitability increased from 6.8% ROI to 16% ROI and turnover is unchanged

I think this algorithm looks like it has changed lots with the movements in profits but a lot of the increased profitability I think is driven from the refreshing of the ratings. I didn’t set out to change too much at all and apart from a few tweaks to odds filters (especially Away odds), the algorithm was pretty much untouched. Given the fact the ratings are badly outdated, I think this makes it appear as if the ratings have changed a lot but nothing too much to worry about.

Similar to the comments on algorithm 1, if people want to follow the same algorithm as last season, I would remove all Home bets less than 1.91 and remove all Away bets less than 2.75. This will take away a chunk of turnover next season and of course, I really hope it takes away a massive chunk of profits next season too since I’ve done all this work!

I haven’t done any analysis at all on TFA value ratings and therefore, assumptions will need to be made that the bets that are different hasn’t changed the picture too dramatically with these value ratings. Given I suspect the vast majority of the bets that have changed is where value is less than 5% (I assume this to be the case but may not be), then I don’t think it should impact the value ratings at all in terms of the higher bands.

Algorithm 3 (systems 31-33)

  • Removed the Home odds filter on 2 of the underlying systems. This will see a handful of Home bets appear on system 31 & 32 at very short odds (1.10+) but they can’t appear on system 33.
  • No change to the Away odds filters on any of the underlying systems.
  • Slight increase in mix towards Home bets for Home/Away bets
  • Average odds have reduced slightly (by 0.04) across all the bets for the last 3 seasons – will be driven by some short priced homes appearing
  • Weightings shifted slightly on all 16 rating factors but the big change was on short-term form as there was a definite issue on this algorithm with this rating factor. I have fixed it now and it has increased profits on Homes significantly over the last 3 live seasons.  
  • Overall, very little changes to this algorithm at all which is probably not surprising given the fact it is the strongest algorithm out of all my algorithms

I’ve done a quick and dirty analysis of the games that would have appeared on system 31 last season based on the old algorithm compared to the games appearing under the new algorithm.

Homes – Profitability increased from -1% ROI to 12% ROI and turnover is up 20%
Aways – Profitability increased from 9% ROI to 11% ROI and turnover is down 10%

I think the changes are minimal on this algorithm although a lot of work has gone into the Home bets to try to understand what went wrong last season. I think I have pinpointed the issue and it was dragging down the profits last season and even over the previous two seasons. I’m confident this algorithm will remain the most consistent algorithm going forward and can build on its previous successes.

Similar to the comments on the previous algorithms, if people want to follow the same algorithm as last season, I would remove all Home bets less than 1.91.

I haven’t done any analysis at all on TFA value ratings and therefore, assumptions will need to be made that the bets that are different hasn’t changed the picture too dramatically with these value ratings. Given I suspect the vast majority of the bets that have changed is where value is less than 5% (I assume this to be the case but may not be), then I don’t think it should impact the value ratings at all in terms of the higher bands.

Algorithm 4 (systems 41-42)  - Significant changes on this algorithm

  • New filters set up for Home and Away bets as old filters weren’t optimising profits at all based on the results over the first 2 seasons
  • Split of Home/Away bets is unchanged although the actual Home/Away bets appearing will look different to the last 2 seasons
  • Average odds look very much in line with what this algorithm had previously
  • Significant changes to all weights across all rating factors as around 30% of the factors were loss making over last 2 seasons
  • Overall, some massive changes to this algorithm and it will look a much different algorithm next season.

I’ve done a quick and dirty analysis of the games that would have appeared on system 41 last season based on the old algorithm compared to the games appearing under the new algorithm.

Homes – Profitability increased from 6% ROI to 12% ROI and turnover unchanged
Aways – Profitability increased from -2% ROI to 10% ROI and turnover unchanged

This algorithm is the one I spent most time on and although I haven’t started again, there are a lot of significant changes to the algorithm from last season. However, when I analyse things like average odds and splits of Home/Aways, the data looks very similar to what the algorithm had before.

I think this algorithm needed a complete overhaul as the first two seasons weren’t great and I’ve spent a lot of time trying to understand where the issues were and tweaked a lot of things. I’ve not done any further analysis to understand how the system performs when cross referred to system 31 for example, so system 31-41 carries a fair bit of risk this season I suspect. Systems 31-42 to 33-42 will look like much different systems to last season which to be fair, isn’t a surprise considering the systems were loss making last season.

I haven’t done any analysis at all on TFA value ratings and therefore, assumptions will need to be made that the bets that are different hasn’t changed the picture too dramatically with these value ratings. Given I suspect the vast majority of the bets that have changed is where value is less than 5% (I assume this to be the case but may not be), then I don’t think it should impact the value ratings at all in terms of the higher bands.

Draw Algorithms (D1 & D6)

I flushed through the data from last season and I think it impacted about 10-15 bets on each algorithm. These 10-15 bets were removed and replaced with others but I don’t think the profitability moved at all. I think given the fact that most of the dataset remained unchanged from when these draw systems were built last Summer, I didn’t expect many changes at all.

Euro Rating Algorithms  (E1 & E6)

Same story as with the Draw algorithms although there were more changes here than on the Draw systems. There appeared to be a bit of a bias towards Away bets last season in the Euro leagues and my refreshed ratings have picked up more Away bets than we actually saw last season live. Not a huge fan of this as I quite liked the fact we had much more of a Home bias on these Euro systems last season than the previous ratings but the impacts are fairly small. 95% of the bets are unchanged as we have moved from last season’s algorithm to the updated one.

Euro Draw Ratings (DE1 & DE6)

No changes as I only built them a few months ago and they have no live results!

Friday 11 July 2014

All Systems Go...............

Just a very quick post to say that all algorithms have now been refreshed and it’s all systems go for next season now in terms of the ratings and spreadsheets.

I think when I set myself the task the of refreshing all the TFA algorithms, I didn’t quite appreciate just how big the task was….I do now! It has taken me not far off a month to complete the work from start to end. I’ve been trying to keep an eye on the clock so I can plan ahead for next Summer if I decide to undertake the same task. I reckon it has taken 60 hours of data manipulation and processing time (I use SAS) to do everything, including setting the spreadsheets up for next season. The fact I’ve managed to do it this Summer whilst at the same time working full-time and doing things around the house in anticipation of our new baby arriving is a great achievement. I don’t blow my own trumpet too much but when I finished this last night, I did let out a little ‘phew, thank fuc* that’s done, well done G!’.

I’ve been taking some detailed notes as I’ve been going so I can keep track of tweaks and I’ll share these notes on the blog in the next blog post. Given I always have to go back to the full dataset I keep and the odds quoted in there aren’t the same as the odds I quote for my bets, it’s always difficult to know exactly what impact the changes have had. I don’t intend on sharing any updated datasets or results for any systems as quite simply, the changes I’m making are tweaks to ratings and systems and not rebuilding anything from scratch. If I thought any of my rating algorithms were needing rebuilt (as I did the Euro ratings for example last Summer), I would have approached this a different way and basically started again with the data and no algorithm. However, I’ve approached this from the point of view that the algorithms were already working as I had hoped and therefore, what could I do to improve the results by including more recent data and checking that all filters were still accurate.

I’ll quickly run through each algorithm in the next post and try to discuss what I think the main changes are we will see next season on each algorithm and the likely impact on the systems. 

What I haven’t found is any new rating factors that were not already included in my algorithms. I spent a good few days looking at the full data set from 2000/01 season onwards and trying to find new rating factors at the outset of this project but I couldn’t find any other factors apart from the 16 factors I’m including in my rating algorithms at the moment. That’s not to say that there aren’t other rating factors I could have included and being honest, I could probably have 100 rating factors for every game if I wanted to but so many would be correlated and wouldn’t add anything to the model. 

I did think of removing 3 or 4 rating factors from the models as quite simply, they weren’t strong enough on their own but when I combined the results with some of the other ratings factors, they looked to be OK. I did have issues with one factor (probably been an issue since the 1st season!) and I took the decision to reverse the factor in all models as quite simply, it was throwing up losses instead of profits. Hence, reversing the factor increased the profits across all ratings and systems!  Worked perfectly from about 2000 to 2009 and then reverses over the last 4 seasons! 

Below is the updated diary of my Summer workload. Can’t believe all the ratings work is now complete and the next few months are the fun part of the Summer as we get to look ahead to the new season and how we use the systems.

I’m hoping to email the subscription base early next week and ask if anyone would want to do a blog post or two about TFA on the blog. It can be on anything they like (good or bad!) but as long as it allows everyone to learn something from it and potentially help new subscribers to TFA, it would be worthwhile. Feel free to drop me an email if anyone is reading this and this appeals to them.

Next step is to write a post on the changes I’ve made to each algorithm and what impact we’ll see on the systems/ratings next season. Let’s see if I can decipher my own notes in Excel!


For those waiting for my help, I still hope to kick-off any email exchanges week beginning 27th July. Two weeks time basically. Thanks to everyone who’s been patient thus far and haven’t bombarded me with emails! I think a couple of you thought I’d gone on holiday due to the fact I hadn’t been posting but far from it, I was doing the hard yards to hopefully improve the ratings for next season.