Wednesday 29 May 2013

2012/13 Season Review Part Four - Systems 31-41,31-42,32-41,32-42,33-41,33-42

I think I’ve had some fairly decent feedback regarding the reviews I’ve written so far. Had a few tweets and emails from subscribers and I think the general feeling I’m picking up is that these reviews are starting to open up people’s minds to the fact the service isn’t only about the 6 Est Combined systems. Being honest, it’s difficult during the season to stand back and take stock of what is happening at times and that’s partly why I spend so long reviewing all the systems after each season. I actually learn a lot about the systems myself from reviewing them in depth and I try my best to drop the odd hint or idea about how we use the knowledge going forward.  Part of the reason my own betting portfolio did so well last season was because I learnt a lot from the reviews last Summer!

One of my long-term subscribers who happens to be a mathematical statistician by trade has correctly pointed out that my statistical significance section is useless and makes no sense at all. Appears a Chi-Square test isn’t the correct thing to use for what I’m doing given the summarised results and therefore, the results for the P-value are inaccurate.

I knew it was a bad idea to dip my toes into statistical analysis given it’s not my background at all (people often think because of my job and footie modelling, I know lots about stats and maths but I actually dropped maths at university as it was my worst subject ;) ). Anyway, given this, I think I should drop this statistical measure from the subsequent reviews. Happy to hear from anyone via email who can give me something to measure my summarised results by that actually makes sense. Only suggestion so far is multiplying ROI*Bets but not a fan of this myself although it allows me to rank systems which is what I’m looking for really.

On to more important things. The two parts of the eason review I’ve most looked forward to writing for a while are the next two parts. The New Combined systems have just completed their first season and the results have been stunning. Likewise, the Misc systems (particularly the Similar Games Systems) have completed their second season and the results have been amazing too. Hence, I expect most subscribers are going to be looking seriously at whether they take the plunge with a New Combined system next season or a Similar Games system as part of their portfolio.

Similar to what I said on the last review, for the detailed analysis section, I’ve used the last 3 seasons worth of data. Hence, two seasons are backtested and one season is live. The last season of backtesting was a losing season, so I think there is some weight to using the last 3 seasons worth of results to try to draw any conclusions once we drill down into the results.

For any new readers, these systems are obviously combined systems from the other 5 systems 31,32,33,41 and 42. Hence, 31-41 means a team that appears on system 31 and 41.

Season 2012/13 Performance


These systems started the season well and at one stage, looked like they were going to achieve a crazy return this season but the last few months were more of a struggle. Even so, looking at the results for each of the 6 systems, they are very good and look like they have great potential going forward.

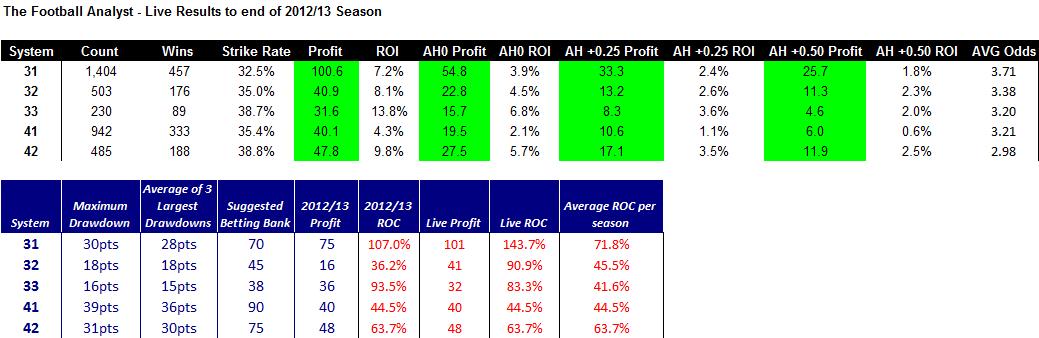
In terms of ROI, it’s pleasing to see the two highest systems lead the way. System 33-41 achieved an ROI of 35.5% from 103 bets and system 33-42 achieved an ROI of 30.5% from 91 bets.  Not bad for their first live season and although the bet number isn’t great, it’s slightly better than the Est Systems 8-21 and 8-22 which makes these systems slightly more powerful I think although with only one season behind them, it’s too early to be jumping to that conclusion.

Given the fact system 32 didn’t have the best of seasons itself, 32-41 and 32-42 struggled a little bit but even so, an ROI of 9.3% and 11.6% is much better than the 5.8% that system 32 achieved, so cross referring the bets has worked well.

I think system 31-41 did well in its first season and an ROI of 7.7% across 612 bets is respectable. I think the system that did best from this whole set of systems is system 31-42 and to achieve an ROI of 14.8% across 366 bets in its first season is outstanding. 42 is clearly a better system than 41 and this shines through in this result.

Overall, a profit of 214pts from 1,641 bets (13% ROI) is a great return for the first season for these Combined systems. As a comparison, the Est Combined systems achieved just over 16% ROI in their first season, so although the New Combined systems look like they’ve started well, they have started as well as the Est Combined systems.

All Live Results


Since this is the first season, the same comments apply from above in terms of the returns.

Looking at the ROC figures, I think the figures are very healthy indeed. System 31-42 leads the way with a ROC of 108.3% last season. Amazing performance I think and it will be interesting to see if it can follow it up next season with a similar performance.

System 33-41 isn’t far behind with a ROC of 91.3% and then you have 31-41 with a ROC of 86%. The other systems all achieved very good ROC’s of between 51.5% and 69.4%.

I think it’s pleasing that these systems not only obtained a high level of ROI but also a very high ROC too. The advantage these systems have over the Est Systems is the bet turnover and therefore, the ROC potential is greater with the New Systems over the course of a season.

Targets for 2013/14 Season


Similar to most of the systems I’m reviewing, the targets for next season don’t look overly stretching if we’re only looking at last season but I’m always wary of the fact that you don’t want to be too bullish after one good season. The targets are all lower than what was achieved last season and therefore, even if the systems don’t repeat this season next season, there is still hope the targets could be met.

31-42 leads the way with a target ROC of 77%, closely followed by 31-41 with a target of 65%. The other 4 systems have targets of between 40% and 50%. Considering the lowest ROC for last season was 51.5% on any system in this group, the targets aren’t impossible.

One thing I should mention is the bet number. When you only have one season’s worth of live results, you can’t be sure that the bet number we saw last season will be repeated again next season. Some systems seem to pick up bet volume and other systems reduce bet volume and trying to second guess the bet volume at times is difficult, so again, if we find these systems have less bets next season, the targets may be difficult to achieve.

Detailed Analysis (Not going to discuss this too much given the fact it is a mixture of backtested and live results)

Performance by Season


A couple of things to comment on here.

Firstly, the systems made a loss during backtesting two seasons ago which is the first ever systems I’d built that had a losing season during backtesting! This is basically what put me off these systems this season and ultimately, they have shown the loss to be a blip I think.

The bet number is very interesting though as since they went live, the bet number is much higher than during backtesting.  Discussed this before on the blog but backtesting will never be a proxy for live results since the odds are captured at different times and given the odds are important in deciding where the bets go on the systems, if I run the systems at the odds at different times, I’d get very different results.

Interestingly, the higher bet number is all on the lower combined systems. Systems 33-41 and 33-42 have a similar number of results as backtesting. The results from this season are much like the results from backtesting in 2010/11 on these systems. The higher bet number is coming from the lower combined systems and I suspect there is a trade-off here between the strength of the bets and the number of bets looking at the ROI.

You can see the impact the draw had two seasons ago where AH0.5 made a profit and yet, backing outright was loss making. Last season, backing outright was profitable but AH0.5 was loss making. Maybe the systems got no luck two seasons ago but got plenty of luck last season? Hard to know for sure but I would have been happier if the systems made a better return when covering the draw. Implies that when the teams weren’t winning, they were losing! I much prefer to know teams are drawing when not winning. :)

Performance by League


All the leagues are highly profitable although the SPL and League One have the lowest ROI. Some interesting trends by League where I see that the highest combined bets on League Two are poor but the lower combined bets in that league are fine! Small samples as always though, so more than likely to be variance.

Performance by League and Season


Some leagues look great last season, others look rubbish! Can’t base any decisions on one season though and the past data is hard to fathom I think.

Performance by Home and Away


Right, I do find this very interesting. Home bets do not look anywhere near as good as Away bets on these systems. That’s the complete opposite to the Est Combined systems if you remember. A 19.1% ROI on Aways and yet, a lowly 4.3% on Homes. 

First thing that pops into my head would be to pick the Aways from these New Combined systems and Homes from the Est Combined systems and see how the results look. Obviously, a bit of backfitting going on in my thinking here as I’m picking the best bets from both sets of systems but it’s definitely something to consider.

I know that on the Est Combined systems, I showed in the past it was better to stake more heavily on Homes but this wouldn’t be the same here. It’s important that people don’t take a broad brush approach to these sort of things and what may seem like a good idea for some systems won’t work on them all.

Interestingly, you can see that the Homes are badly affected by draws as the returns are quite similar across each of the betting methods. Can’t say I’ve ever seen this before too often and I suspect the Homes must be affected a fair bit by draws given the average outright odds are 2.22, so the AH0.5 odds would be heavily odds on, so making a 4.3% ROI by backing at heavily odds on is very rare.

Performance by Home and Away by League


Lots of small data sets that are losing money here but with one season’s live results (and one season included which is loss making), I think we need to see another season of live results before we jump to conclusions. BSq Prem Homes, League One Homes, Premiership  Aways and SPL Homes are all loss making! A little strange considering the overall returns but all it means is the Aways must be much better for each league which fits in with what I said above with Homes v Aways.

I think quite a few people are going to be interested in these combined systems next season but I think the key thing from this review is the fact that Homes look a little dodgy and Aways seem to have huge profits for outright betting but I’d be slightly wary of using AH betting on the Aways after last season’s performance where the teams tended to win or lose!

Tuesday 28 May 2013

2012/13 Season Review Part Three - Systems 31,32,33,41,42

I think this review (and the New combined systems review next) are going to be the most difficult to write since if I base it on live results, we have systems 31-33 with two seasons of live results and 41-42 with one season. If I base it on two season’s results, we have a mixture of live and backtested results and as we know, last season wasn’t indicative of the performance this season as it has been better for the New Systems this season than last season. If I go back too far, results get clouded with too much backtesting and therefore, there is no right or wrong answer here.  Assuming that people want to play some of these New systems after this season, then I think they have to take into account more than just one season to get anything meaningful for analysis purposes when we look at results by league etc.

After a bit of consideration, I am going to look at the last 3 season’s results for the detailed analysis at the end of the review. This gives a big enough data sample to draw meaningful conclusions, it includes last season which was very poor for the combined systems and it includes one season of full backtesting which will gives the results a bit of a boost but it’s the trends were are interested in, rather than the actual figures in the detailed analysis section.

Any previous backtested results prior to season 2010/11 can be found on the historical results section on the blog.

Season 2012/13 Performance


These systems started the season very well and have probably ended the season in a bit of a slump if I’m honest but similar to the first two reviews, when you look at the overall season results, you can’t have too many complaints.

System 31 was the star this season I think and to achieve a 10.2% ROI from 733 bets is very good over a season.  It is very disappointing that system 32 couldn’t improve upon this return and ended up with a slightly disappointing 5.8% return. Hard to know where it went wrong for system 32 this season as it was picking from a very good set of bets but ultimately, didn’t manage to do that well at all. 

The biggest shock though (and maybe the biggest shock of all the TFA systems this season) was system 33. It was the only system that made a loss last season from all my live systems and going into this season, I didn’t give this system much hope at all. However, from the very start this season, it has performed very well and to end the season with a 34.2% ROI from 104 bets is stunning.

System 41 was in its first season live and a return of 4.3% from 942 bets is disappointing considering it was above the 5% return for most of the season.  It actually started the season very well and at one stage, 10% ROI wasn’t outside the realms of probability but the second half of the season was tougher for this algorithm. 

System 42 did really well though and managed to increase the ROI to 9.8% from the 4.3% on system 41.

Overall, 214.6pts profit from 2,545 bets at an ROI of 8.4%. A very good season and definitely lots of hope for the future here I think.

All Live Results (last 2 seasons for 31-33 and last season for 41-42)


I think the ROI trend is the key again here and as you move up the systems, the ROI increases. Wind the clock back 12 months and it wasn’t like this for systems 31-33 but I think as I said then, it was most likely down to variance. 

System 31 suddenly looks like a system that could be worth following now with an ROI of 7.2% from 1,404 bets. Even after a disappointing season this season, system 32 looks OK with an ROI of 8.1% from 503 bets. Finally, we can see that system 33 has recovered somewhat from a losing first season and now has an ROI of 13.8% from 230 bets. Still early days of these systems with two seasons behind them but so far, so good I think and the fact they have come through a poor first season actually gives me hope that they may be OK systems long-term.

Systems 41 and 42 have the same comments as above since this is their first season.

In terms of ROC, system 31 led the way this season and is the first system I’ve reviewed so far who has managed to double the betting bank in a season. An ROI of 107% is amazing.  I should also pick out system 33 who somehow achieved an ROC of 93.5% this season after losing money last season! Would have taken a massive leap of faith to follow system 33 this season I think but shows that you shouldn’t judge a system on one poor season if you think it is still working as you hoped when it was built.

Interesting that system 42 managed a better ROC than system 41 this season but looking at the bet number, I would say this wouldn’t be the normal thing to expect. 

Overall, the average ROC’s per season are quite decent for these systems and this is something that should be taken into account when people are building their portfolios going forward, whether it be these systems or the Combined systems.

Statistical Significance


I think the key here is how much more statistically significant system 31 is compared to the other 4 systems. Again, something that you should take into account. Some of the least statistically significant systems I’ve reviewed so far appear in this group of New Systems, so I think that’s another point to remember when setting portfolios for next season. These systems have started well but it is very early days for them I think. I’ve been saying the same all season if I’m honest and nothing has changed now we’ve reached the end of the season.

Targets for 2013/14 Season


I think that when looking at targets, we need to remember the number of live bets and statistical significance when deciding upon how accurate these targets may turn out to be. It is early days for these systems and therefore, the targets we set probably come with a bit more risk than the systems where we have 3 seasons of live results. Of course, it may be the case I understate the targets and they are easily beatable but more likely is the case that we undershoot the targets as we don’t really know the true underlying performance yet.

I didn’t mean to be cautious but a quick look at the 2012/13 ROCs and then the targets and it does look like the targets may look low. However, the targets are based on the long-term view and more importantly, I think system 31 and 33 probably outperformed last season, so you don’t want to be banking on this every season to make your return.

Systems 31 and 42 lead the way with a target ROC of 50% next season. Again, based on this season it looks low but based on the first two seasons for 31 in particular, it’s not too far off I think as a target.
The other 3 systems have a target ROC of 29%-40%.

I think the interesting system is system 33. Based on the returns from last season, this target ROC for next season looks very low. During the first season when the system had a losing season, it didn’t have any massive drawdowns, it was just generally hovering around break-even all season and then finished with a small loss. Hence, the betting bank isn’t huge and if it creates anywhere near the profit it created last season, the potential is massive for this system. However, with the very low turnover, variance may play a part (probably played a part last season in creating an amazing return) and therefore, it’s a risky proposition but might well be worth following in a portfolio of systems.

Detailed Analysis (Not going to discuss this too much given the fact it is a mixture of backtested and live results)

Performance by Season


I think the interesting thing to point out here is the fact that the overall returns from last season and this season are so similar. An 8.3% return two seasons ago and an 8.4% return this season. If you go back another season, you can see how much better the backtested results were before the systems went live.

It’s hard to draw too many conclusions from looking at the results from the first season as I mention in the introduction but I think any trends from the first season shown can hopefully be used along with the last two seasons to allow us to draw some meaningful conclusions.

Performance by League


You can see that the two poorest performing leagues are the SPL and League One. A slightly different pattern from what we saw when we looked at the Established Systems in the previous reviews where it was clear that League Two was an issue.

Performance by League and Season


The most interesting thing here is the fact that League Two made a substantial profit last season! This goes against everything we saw with the Est Systems.  Interestingly, the Premiership and SPL were the worst performing leagues last season.

Performance by Home and Away


Aways are more than twice as profitable as Homes and the trend is pretty consistent across all 5 systems.

Performance by Home and Away by League


Some strange figures thrown up here compared to the Est Systems. Biggest difference is probably the fact League Two Aways are profitable here and League One Homes are loss making. A substantial loss is created on SPL Homes and the SPL is proving a tough nut to crack across all the algorithms I think as the Est Systems struggled in the SPL too. 

Monday 27 May 2013

2012/13 Season Review Part Two - Systems 6-21,6-22,7-21,7-22,8-21,8-22

In many ways, this is the most important season review I’ll write. The majority of members with the service follow at least one, if not multiples, of these systems and therefore, it’s important that anyone following the service reads this review. 

Over the first 3 seasons, these 6 combined systems have also been the systems that have been proofed and reported on by the Secret Betting Club and ultimately, it is these systems that have been responsible for the various awards the service has won over the last couple of seasons.  Going forward, I hope the service will no longer be judged on the performance of 6 systems considering there are a whole host of profitable systems for people to follow but these systems are always likely to underpin the service to an extent.

This is the 3rd season that these systems have been live and all results in this review are live results. I will no longer be discussing the backtested results from 2006/7 to 2009/10 and if people are interested in these, they will find the results in the historical results section on the blog.

For any new readers, these systems are obviously combined systems from the other 5 systems 6,7,8,21 and 22. Hence, 6-21 means a team that appears on system 6 and 21.

Season 2012/13 Performance


At various points this season, it looked like these systems were going to struggle to create much profit at all and from being in a loss making position at the end of Jan-13, it’s amazing that they have managed to scrape through a poor season with a profit of 113.8pts!

Similar to the first systems I reviewed, if you stand back and look at these results, you have to be pleased. Yes, it’s maybe not been as good as the first two seasons but another 100pts over a season isn’t bad at all.

6-21 is the system which underpins these systems and a profit of 7.6% from 563 bets is a decent return. I think the same comment goes for 6-22 which managed to improve the 7.6% ROI to 11.4%.

7-21 also did a good job of improving on the performance of 6-21 and 8-21 did likewise. 8-21 actually had an exceptional year if I’m honest and managed to turn a profit of 8.8% on 7-21 into a profit of 21.3%. That is exactly the way the systems were meant to work and as you’ll see on the long-term results, it works well.

It maybe feels slightly harsh saying this but the two biggest disappointments this season were 7-22 and 8-22. As always, it needs to be looked at in context and 7-22 achieved an ROI of 9.8% and 8-22 achieved an ROI of 10%, so it wasn’t a disaster of a season but considering 6-22 had an ROI of 11.4%, it is disappointing that the next two systems in the pyramid couldn’t improve upon this return.

I think for long-term followers of these systems, I’m sure they’ll have a similar view to me that this season was anything but a vintage season for these systems whereas for anyone who was new last season, maybe they’ll see this season as a really good season. I think a lot of this game is about expectations and over the first two seasons, these 6 systems in particular built up a very high level of expectation and for whatever reason last season, they couldn’t quite reach the expectation levels.

I think the interesting thing is that going forward, there won’t be quite so much pressure on these systems hopefully. Given the fact that there are now multiple systems which have returns almost as good as these, that should mean the weight of expectation is spread around and therefore, I expect many people to have less weight on these systems in their portfolios going forward.

Overall then, a profit of 113.8pts from 1,168 bets in a very tough season is a good return and I’m sure I’m not alone in thinking about what the return would have been if the systems had a decent first half of the season…oh, wait a minute, that would have been like the last two seasons!

All Live Results (last 3 seasons)


I think the thing that jumps out to me looking at this is the trend we see with the ROI and the systems. You can see how filtering the bets works and the ROI improves as we move up from 6-21 to 7-21 to 8-22 and the same is true where 8-22 beats 7-22 and 6-22. To complete the perfect trend, 6-22 beats 6-21, 7-22 beats 7-21 and 8-22 beats 8-21. When I started out 3 years ago, I sort of hoped that this trend would be apparent and it’s amazing that after 3,000 bets, this trend is very clear.

Although the overall ROI has taken a hit after the lower ROI this season, I think an overall ROI of 13.3% from 3,160 bets is highly acceptable. 419.5pts profit over 3 seasons is something I would have bitten someone else’s hand off for 3 years ago, so I think it’s a nice start to the service.

I think the ROC figures are all very well good and you can see why so many of these systems are included in portfolios of subscribers.

System 6-21 leads the way with an ROC of 95.4% last season which gives an ROC of 273.9% across the first 3 seasons. To make circa. 90% ROC each season for 3 seasons in a row is great going and probably puts this system up there with the best betting systems in the market.

In terms of ROC, 7-21 has now overtaken 7-22 after last season but both have an overall ROC of around 175% after 3 seasons. 7-21 achieved 41.2% last season whereas 7-22 only achieved 26.1% in a poor season.

The other 3 systems all have a similar long-term ROC in the region of 135%. 8-21 performed best lasts season with an ROC of 51.6%.

I personally think that any tipster system with a long-term record of achieving 40%+ ROC per season is worth serious consideration and all 6 of these systems fall into this category. System 6-21 looks worth following and a lot of the same comments apply to 6-21 as apply to 21.  I think the choice people have is to include system 21 or 6-21 in their portfolio and these systems should form a good base on which to build the remainder of the portfolio.

Similar as I said regarding system 21, I wouldn’t put anyone off just following system 6-21 in isolation if someone wants one system to follow next season.

Statistical Significance


As you would expect, all 6 systems appear statistically significant but system 6-21 is similar to system 21 in the sense that it is impossible to think that these results don’t show a substantial edge.

The least significant system is 6-22 and it’s a system I’ve never liked myself. Doesn’t have enough bets and doesn’t have a big enough edge. 8-22 struggles a little due to the low bet volume but the results still look OK.

Targets for 2013/14 Season


As I said with the first review, this section is maybe the most important for subscribers to absorb. Don’t want to keep restating what I said in the earlier post but although there can be no guarantees when it comes to setting targets, it’s important that people make informed decisions around which systems to follow and these targets should allow them to do that.

Firstly, I’m tweaking the betting banks upwards for a few of the systems, thus reducing the target ROC they can achieve going forward but I feel it is necessary after seeing how poor the performance was at times last season.  System 6-22 is seeing the bank increased to 50pts (from 42ps), 7-22 is seeing the bank increased to 40pts from 35pts and 8-22 is seeing the bank increased to 35pts from 32pts. I always like to think my banks are conservative and these betting banks just need increased a little to get back to the same level of comfort I had in the banks before.

In terms of targets, 6-21 is looking at a target of 86% ROC next season. The other 5 systems are pretty well grouped thereafter. System 7-21 has a target of 44% and then the next 4 systems are 38%,36%,34% and 30%. 

Again, I think you can see how important ROC is compared to ROI and the system with the lowest ROI has the highest ROC by a long way. There is a trade-off between ROI and turnover and unfortunately, I think for the 5 highest combined systems here, they don’t quite have enough turnover. That’s not to say that they shouldn’t be followed though and the last thing I want is everyone following 6-21 or system 21 next season and then watching as these couple of systems struggle while all the lower turnover systems have a storming season!

 Detailed Analysis

Performance by Season


I think this really paints a picture that this season was the toughest season by far which I think is what I thought myself. However, part of this is due to the fact the first season was stunning, the second season was great and this season would probably be classed as good.  The bet number was higher this season which probably in a way reduced the quality of the bets but then again, if you look at system 6-21, it has done much better than the first season in terms of points won.

I think the key trend that shines through here is the fact the higher combined systems were nowhere near as good as the first two seasons whereas system 6-21 and 6-22 weren’t much worse than the first two seasons. Interestingly, system 8-21 had its best season so far whereas the other higher combined systems 7-21, 7-22 and 8-22 all had their worst season.

You can get too bogged down looking for trends and I’m happy to move onto next season believing that this season was the worst season so far but then again, the systems were loss making at the end of January. Hence, it could have been a helluva lot worse for a poor season!

Performance by League


A very similar story to the previous sytems where you can see the only issue is League Two. However, League Two is the only league where you can make a much better profit using draw coverage than backing outright and therefore, the selections from this league have really struggled with the draw over the first 3 seasons.  I remember the League Two bets made a small loss the season before last after a really poor first season, so what happened last season?

Performance by League and Season


Well, it was another small loss in League Two again last season. That makes it 3 seasons in a row where losses have been made. Interestingly, the draw wasn’t to blame at all and therefore, it was a really poor season for League Two bets.

On the other hand, Bsq Prem bets had a great season and yet, the same bets had a losing first season, so it shows things can turn around quickly. 

The remainder of the leagues did OK apart from the SPL which had a losing season.

Performance by Home and Away


I find this very interesting. At the average odds and looking at the previous set of single systems, you would have bet good money on the Aways having the highest ROI here but amazingly, the Homes are better than the Aways on the combined systems.

A 17.2% ROI for the Home bets against an ROI of 11.7% for the Away bets is strange given the difference in average odds. To make a 17% ROI from bets with average odds of 2.11 is stunning and if you look at some of the higher combined systems, the Home bets are very strong. All combined systems from 6-22+ have ROI’s in excess of 19% for Home bets.

Interestingly, if you just look at system 6-21, the Away bets have a higher ROI but clearly, the systems are able to filter out the poor Home bets much better than the poor Away bets.

I know one person with the service who only plays Home bets and one thing a lot of subscribers do is play higher stakes on Home bets than Away bets and I think we can see why this works so well.

Performance by Home and Away by League


Similarly to the first set of systems, there are a lot of really strong results here that jump off the page.

It’s again amazing how different the ratings perform for League One and League Two Aways. A 160pts profit with League One Aways is offset by a loss of 116.8pts from League Two Aways! League Two Homes are actually very strong and therefore, if anyone is seriously considering doing something with League Two Aways (e.g. dropping them!), then I’d remember and keep backing the Home bets.

League One Homes and SPL Homes both tread water from not a lot of bets but with the sample sizes being so small, it’s hard to draw conclusions I think.

Similar to what I said at the end of the first season reviews, I’m not against people varying stakes based on some of these trends being shown as long as they don’t go mad! The sample sizes by league are all very small and none are highly statistically significant but sometimes, you have to go with gut feel at times and for me personally, my patience with League Two Aways is wearing thin! I won’t be alone in feeling like this…….

Sunday 26 May 2013

2012/13 Season Review Part One - Systems 6,7,8,21,22

This is the first season review I’ve posted and there are going to be 8 season reviews in total. Last Summer, I probably spent too long on the season reviews aspect as I reviewed all systems individually.  Given the fact there are twice as many systems to review now, I couldn’t spend anywhere near as long on each system as I have in the past. 

The 8 season reviews are going to cover:

1). 6,7,8,21,22
2). 6-21,6-22,7-21,7-22,8-21,8-22
3). 31,32,33,41,42
4). 31-41,31-42,32-41,32-42,33-41,33-42
5). 6-32,21-31,6-21-31,TOX, STOY and STOZ
6). E1,E2,E3,E6,E7
7). E1-E6,E1-E7,E2-E6,E2-E7,E3-E6,E3-E7
8). Under/Over 2.5 Goals Systems

In terms of layout, I’m going to look at the following aspects in order:

Season 2012/13 Performance
Live Results to Date
Statistical Significance (P-value)
2013/14 Targets
Detailed Analysis

I’ll be concentrating on ROI, ROC, Drawdowns and updated betting banks in the main. The 2013/14 targets are going to be what subscribers should be most interested in I think as it shows what we’re aiming for next season.

I’ll finish off each review by looking at a variety of things including performance by season, league and by Home and Away bets.  I can’t imagine that every review is going to be interesting to everyone but hopefully some readers will pick up something that interests them from each review. The point of spending time reviewing the past is to give us any insight into the future to help our betting going forward. I don’t think it’s any coincidence that most subscribers with the service make more money the longer they are with the service. The more understanding each subscriber has, the more likely they are to make more money in future.

I will be releasing a spreadsheet for download after I’ve completed each of the season reviews and this will have all the tables in it I’ll be using in the reviews. Therefore, people can do their own analysis if they wish and the spreadsheet should be used in conjunction with reading the system reviews.

So, I’ll start with the review of systems 6,7,8,21 and 22……………

This is the 3rd season that these systems have been live and all results in this review are live results. I will no longer be discussing the backtested results from 2006/7 to 2009/10 and if people are interested in these, they will find the results in the historical results section on the blog.

Season 2012/13 Performance


I think it’s a pleasing 3rd season for these systems if you look at the results now the season has finished. The systems started the season very slowly and at various points this season, the systems have found it tough going but class always shines through in the end I think.

Systems 6 and 21 are always key as these are my first two algorithms I developed 3 years ago. System 6 has struggled this season if I’m honest but a return of 4.4% from 725 bets isn’t a disaster.

On the other hand, system 21 had a really, really good season again. An ROI of 9.8% across 598 bets is pretty phenomenal for a set of ratings and to make near 10% return from backing each of the games blindly makes this algorithm one of the best in the business I suspect.

If I was being critical, I would say that it’s very disappointing that system 7 and system 22 couldn’t improve upon the returns of 6 and 21. System 7 really struggled and turned a 4.4% profit into a 2.9% profit but system 22 did a better and at least managed to maintain an ROI in line with system 21 (9.2%).  I think once you see the overall live results, the picture looks a bit clearer and it’s probably just a bit of variance this season impacting 7 and 22 as they don’t have a lot of bets.

In terms of ROI, the star of the show this season was system 8. A 14.2% ROI from 103 bets is a very good return. It’s a little strange that system 8 had such a good season when 6 and 7 struggled so much but again, I suspect it’s variance again but this time, it’s positive variance! Anything can happen over 103 bets and all it takes is a couple of games to go the system’s way and it can bump up the ROI a fair bit.

Overall, a profit of 125.8pts from 1,805 bets this season for these 5 systems means a respectable 7% ROI and you have to say it has been a good season for the Established ratings again this season.

All Live Results (last 3 seasons)


I think the first thing to point out is the trend of ROI as you move up systems. System 6 has an ROI of 4.9% from 2,010 bets but the ROI improves to 6% on system 7 and 10.8% on system 8. The same story applies for the second algorithm where the ROI increases from 8.5% on system 21 to 10.4% on system 22.  Therefore, the filtering of the ratings by the systems appears to work as I intended it to and clearly, the systems are able to pick out the better bets. As this season shows, over a smaller sample of bets, this phenomenon may not occur but long-term, the trend remains.

I think with 3 seasons behind these systems now, you have to be pleased with these results. It is now clear that algorithm two is better than algorithm one but I’ve known that for a while. I learnt a lot about building a successful rating algorithm after I built the first algorithm and therefore, it was always likely to be the case that the second algorithm would turn out to be better than the first algorithm.

In terms of Return on Capital (ROC), the results are variable by system but all 5 systems have decent results. 

I think the ROC figures are key. I know people get sucked in by the ROI some of my systems have but as I’ve been saying for a long-time now, ROC is the key at this game.  System 21 leads the way with a ROC of 97.5% this season and a ROC of 233.6% over 3 seasons.  To nearly double your betting bank in one season is a great achievement and an average ROC of 77.9% across 3 seasons makes this a very, very powerful system in its own right.

Not surprisingly, system 6 is the second best and this system managed to achieve an ROC of 53.7% this season even though it hasn’t had the best of seasons.  This is actually very consistent with the long-term performance though and over the first 3 seasons, it has achieved an ROC of 164.6% with an average ROC of 54.9% per season.

The other 3 systems aren’t really made for achieving a high ROC but even so, if you look at the performance of these systems over the 3 seasons, it isn’t bad. An average ROC of 24%, 25% and 30% across 7,8 and 22 are highly acceptable for any tipster I think but in the TFA portfolio, this puts them down as systems that people shouldn’t really be following.

Statistical Significance

Here are the P-values for each system.

Not surprisingly, all 5 systems are highly statistically significant but the chances of system 21 achieving the results it has achieved by luck (an 8.5% ROI over 1,649 bets) is 1 in 50 million I think! The least significant are systems 8 and 22 but even then, a P-value of 0.5% and 0.3% is still highly acceptable and show that these systems aren’t achieving these results by luck!

Overall, I think you have to be pleased with these results for the 5 Established Systems and that’s 3 successful seasons in a row for these systems.

Targets for 2013/14 Season


I think for many reading this, the most important aspect of the reviews are going to be the targets for next season. I will state the official betting banks for each system as well as the target ROI and ROC that the systems will be looking to achieve next season.  No guarantee that any system will do what it sets out to do but you need to have targets in this game and with so many systems to choose from, these targets can be used to help subscribers (and myself!) decide which systems to include in our portfolios next season.

I think the first thing to point out is that I am tweaking the betting banks on system 8 and 22. The betting banks are basically overstated as the losing spell that sets the banks occurred in a bad run 3 seasons ago and with the bet number these systems have nowadays, the betting bank looks very conservative based on the last two seasons performance.  System 8 is now going to have a 40pt betting bank and system 22 is going to have a 50pt bank. Given the low bet number, the systems could never lose the full betting bank in a season I think but I’m happy to go with these new betting banks.

Not surprisingly, system 21 has the highest target ROC next season and will be aiming to grow the betting bank by 80%.  We then have system 6 with a target ROC of 47% and then the other 3 systems all have a ROC target of less than 30%.

Importantly, the targets I set are always based on past performance and if the systems perform as they have done for the first 3 seasons, these targets should be well within reach.  As I said above, no guarantee that any system will achieve what it sets out to do but at least those following can look at the historical performance and that should help set expectations about the upcoming season.

I expect system 21 may actually prove to be a popular system next season given the performance over the first 3 seasons, the P-value and the target ROI/ROC next season.  Wouldn’t put anyone off only following system 21 in isolation if wanting to follow a single system from the Est Systems.

Detailed Analysis

I’m not going to go into a great deal of depth on each aspect but I’ll paste the tables and people can do their own analysis if they like.

Performance by Season


You can see clearly that this season hasn’t been as good as the 2011/12 season but then again, it is better than the 2010/11 season.  If you look at the AH returns, you would say that the only reason the first season was worse than this season was due to the fact the systems struggled a lot more with draws, so in many ways, this season has been the toughest of the 3 seasons to date. I think that probably backs up my own thinking about these systems this season and it has been a tougher season than the first two seasons but it has still been a decent season.

Performance by League


This isn’t a surprise to anyone who has been following the systems for a while but the poorest performing leagues are League Two (where a loss has been made over the first 3 seasons) and the Bsq Prem (only a 3.2% ROI). Again though, if you look at the AH returns, League Two has hit a fair number of draws and if using AH0.5, a profit is made, so I’ve not given up on this league yet!

The Premiership continues to be the best performing league by far with an ROI of 28.6% across the first 3 seasons to date. 

As a side note, I know one person last Summer told me they weren’t following any more League Two bets and I think I mentioned this on the blog last year. Was it a good idea?

Performance by League and Season


As you can see, League Two actually created a small profit of 8.9pts from 482 bets this season. Not great but a good step forward. The poorest league in the 2012/13 season was the SPL by far. A loss of 25pts from 107 bets.

Performance by Home and Away


Nothing too surprising here. Twice as many away bets than home bets but the average odds are much higher for Away bets (3.64) than for Home bets (2.16). This is reflected in the strike rates where Homes have a strike rate % of 51.2% and 31.4% for Aways.

In terms of the returns, a 7.6% ROI for Away bets and 6.2% for Home bets.  Again, given the average odds, we’d expect the Away bets to achieve a higher return.

Performance by Home and Away by League


I think this is maybe the most interesting table from this section. There are a lot of trends on show here and whether or not they will continue is uncertain but it maybe highlights some weaknesses within the ratings for these systems as well as some strengths.

Aways are better than Homes in the Bsq Prem and Homes are only break-even in 3 seasons in this leage.

Championship  Aways are very strong whereas the Homes are only marginally profitable.

League One Aways are very, very profitable whereas Homes are loss making.

League Two Aways are very, very unprofitable whereas Homes are very, very profitable.

Premiership Aways and Homes are both very profitable.

SPL Aways are very profitable but the Homes are loss making.

Now, what do we make of all of the above? Well, firstly, the sample sizes aren’t great but I think there is a clear issue in League Two where the draw is a pest for the Aways. A -10% ROI for backing outright but a -1.3% ROI for backing using AH0.5 is a stunning turnaround for backing the draw and simply, if we were to only be backing the draw in these games where we’re on the Away team, we’d have a very healthy profit.

The strange thing for me is that League One and League Two are right next to each other on the football pyramid but clearly, my ratings work great for Aways in League One but not for League Two but likewise, my ratings work great for Homes in League Two but not in League One!

It’s hard to fathom and I can’t help but feel it’s just variance but I wouldn’t be against anyone deciding to vary stakes based on some of these trends as at the end of the day, we have 3 seasons worth of data and some of these trends have been around since the beginning and aren’t changing!

Monday 20 May 2013

May-13 Monthly Review

This is a short monthly review. Not going to review the systems in any great depth at all as there is no need. One partial month doesn’t tell you much although I think it shows what can happen when things don’t go your way if you have a set of systems with no clear edge. The Euro systems managed to lose all of the season’s profits and a helluva lot more this month and it’s quite amazing really. If I had packed up the systems at the end of March, it would have been a different story.

At the end of March, the Euro systems had a profit of 147.3pts from 2,211 bets. At the end of season, this now reads….A loss of 127.7pts from 2,880 bets. Hence, the systems have lost 275pts from 669 bets. If you assume that the bookies play with a 5% overround, it’s a remarkable achievement to lose so many points in a small sample of bets!

The loss is much lower if using any form of draw coverage and therefore, the draw has been a pest but even so, it is a shocking performance from the systems. Now, people could point out that 669 bets isn’t a big sample and of course, they are correct but as I’ve been saying on the blog for a while, these systems have struggled all season. They haven’t performed anything like what I expected (or hoped) and therefore, it’s better that we at least see the true underlying results now rather than stagger onto next season with the same set of systems and then lose a small fortune thinking we’re following something with an edge.

Anyway, I will keep my other comments on the Euro systems until I do the season review of them but let’s just say these systems are my first failure at this football betting game. The irony is, even though the systems have been terrible, I doubt anyone has done much damage at all and it was probably a lucky escape for all of us following these with small stakes this season. Next season, I’ll give the Euro leagues another go but I won’t be following with small stakes. I will paper trial the systems which is something I have never really done with my systems before (a lot of work for nothing!) but I’m scarred after seeing the poor run to end this season!

Here’s the monthly review.

Est Systems


Amazed that these systems made a profit when all the other systems were terrible but they managed it. A profit of 3.4pts from 21 bets. The combined systems made a profit of 3.7pts from 6 bets. Given the mess the other systems made, you have to say these systems did well to keep their powder dry and if they had more bets, I’ve no doubt that they would have lost money this month.

New Systems


A loss of 4.3pts from 50 bets. No real damage done and the combined systems scraped a small profit which is always pleasing.  A really good first season for these combined systems in total and should give us another profit opportunity next season hopefully.

Misc Systems


 A small loss of 0.7pts from 20 bets.  No real damage done and it has been a great season for these systems.  I was disappointed with the first season but I kept my nerve (others would have binned these systems I suspect!) and it has paid dividends.

Under/Over Systems


 A loss of 1.3pts from 10 bets. Sums up these systems….rubbish!

Euro Systems


36 winners from 326 bets says it all really. A loss of 201.2pts from 326 bets. I remember the time when the Est Systems lost nearly 100pts in a month and I thought that was nearly impossible but boy, this loss takes the biscuit! The base ratings were terrible but trying to narrow down a set of terrible bets and make it worse is quite difficult to do but these systems managed it. E2-E7 managed to draw a blank from 14 bets which takes some doing. Lots of draws in there but still, a shocking month!

Well, I hope I don’t post too many months as bad this one. A loss of 204.1pts from 427 bets. Not much more to add but say the Euro systems are not much good to anyone I’m afraid!