Monday 29 June 2015

Euro Draw Systems Season Review 2014/15

If I was most looking forward to reviewing the Euro systems on the last post, it’s safe to say reviewing the Euro Draw systems is the thing I’m least looking forward to this Summer.

If I wind the clock back 12 months, I had just had a pretty decent first season with UK Draws and therefore, it seemed a natural progression to take a look at Euro Draws in the Euro leagues. I had plenty of reservations though and given my first set of Euro systems flopped in their first season, I think I had my doubts whether or not the same could happen here. My other issue is well documented but basically, backing Draws in the Euro leagues isn’t exactly an easy place to make money. Historically, the underlying losses for backing Draws was on average of 7.5% going back to 2006/07 season and therefore, I had my doubts about finding an edge. I think the combination of both the doubt about the Euro leagues and the doubt about Draws in the Euro leagues should hopefully have helped people didn’t get carried away with these systems last season. 

It is somewhat ironic that based on the underlying results, season 2014/15 was the second easiest season for Draws in the Euro leagues in the last 9 seasons! There was an overall loss of 2.7% and a strike rate of 25.8% over the season and therefore, it wasn’t impossible to make a profit last season if you had an edge in these leagues. Clearly, as we’ll see, I had no edge and wasn’t even close to finding an edge.

I better just get on with sharing the results for last season:


Considering the Euro systems a few years ago had a nightmare season and lost 127pts, this takes losing to a complete new level. A loss of 297.8pts at an ROI of -11.9%. All 11 systems made a loss and the average loss was 27.1pts on each system.

It’s hard to know where to start here.

The ratings themselves were very poor, with both rating algorithms losing 9.8% and 13.6% respectively. This accounts for a loss of 41pts and 61pts loss on each algorithm. If your base is this bad, it’s impossible to imagine any system could make a profit and even cross referring systems isn’t going to help too much as the losses are so extreme.

The filtering between DE1 to DE2 to DE3 didn’t work at all and as you reduced the bet number, the ROI simple deteriorated which is the opposite of what is supposed to happen! The filtering from DE6 to DE7 did work better though and a loss of 13.6% on DE6 was reduced to a loss of 2.7% on DE7. There were 230 bets that appeared on DE6 but not DE7. These 230 bets lost a total of 55.2pts which is an ROI of -24%. Considering the underlying loss was only 2.7%, this is an unbelievably bad result.

Looking at the combined systems, I’m not sure the picture improves. If anything, it’s just as bad, if not worse. DE1-DE6 lost 12.8% which was closer to the losses on DE6 than DE1 unfortunately.

DE1-DE7 did OK as DE7 did OK but again, there was no real improvement from cross referring the systems. DE2-DE6 did worse than DE2 or DE6 and the same is true for DE2-DE7 when compared to the single systems.

DE3-DE6 and DE3-DE7 both had nightmares and lost over 20% each which takes some going over a season backing draws!

Overall, a total and utter disaster and based on these results, all you can say is that you’d need to rip up the systems and ratings and start again if you wanted another attempt at doing something with Draws in these leagues.

To try to give a little insight into the issues these ratings and systems faced, here’s the breakdown by league for last season:


As you can see, France was a major issue. My ratings obviously favoured this league for Draws due to the low goal expectancy historically but last season, the strike rate dipped massively in this league. The underlying ROI for backing draws in France was -18.4% which meant you were always going to take a bath backing draws in this league.

If you simply ignore the French league (I know you can’t do this but just pretend!), then the overall results were not anywhere near as bad and although it would have still been an 83pt loss, nothing like the 297.8pts loss the systems suffered.

I’m sure if I drilled into the results deeper, I can find lots of examples of last season’s results being nothing like the historical results for subsets of bets but this is the same in every league. It’s how your ratings cope with this that determines their profitability long-term I think and last season, my Euro Draw ratings couldn’t cope at all.

Summer Action – I need to decide whether or not I want to continue with looking for an edge at Euro Draws next season. At the moment, I would say it’s probably the end for these systems but I’ll spend some time this Summer seeing if I can develop another set of ratings quickly. I’m not investing too much time though! Even if I do have Euro Draw systems next season, they would be trial systems at best and I wouldn’t touch them with a bargepole after this season! 

Euro Systems Season Review 2014/15

I think the only systems I’ve been looking forward to reviewing this Summer have been the Euro systems. Before we get onto last season’s results, it’s worth recalling the history of these systems over the 3 seasons so far.

The first season was season 2012/13 for the Euro systems. I decided I wanted to branch out into the European leagues for a couple of reasons. The obvious reason is for additional diversification and I didn’t want to put all my eggs into one basket when it came to the UK leagues. I was also acutely aware a few years ago that my edge would be eroded as I started to lose bookmaker accounts and therefore, with liquidity becoming a little bit of an issue, branching out into European leagues seemed like a good move.

When the systems went live though, it was clear there wasn’t much of an edge. Although the results were not a disaster, given the Home bias that was apparent in the Euro leagues, launching systems with 70%+ of bets being Away bets was never going to work I think. Here’s the results for season 1:


Although not a disaster of a season, a 4.4% loss across all systems and the fact that both rating algorithms lost 4.5% and 9.3% respectively meant that I made the decision that I needed to start again and basically scrap these ratings completely. My main concern was the Away bias within the systems and when I built the systems, the intention was to match the UK methodology which obviously has an Away bias within the ratings. Considering the Home bias in the Euro leagues, I was basically fighting against the underlying results and therefore, I realised I had no edge with these ratings.

I spent the Summer of 2013 building a brand new set of rating algorithms for the Euro leagues and corrected the Home and Away bias. Here’s the results for the first season of these new ratings:


All 11 systems were profitable, both rating algorithms were profitable and the combined systems did pretty well overall. Of course, it would take more than one good season to wipe out the losses and memories of the first season but overall, it was a step in the right direction at least.

So, that brings us onto last season’s results. Going into the season, I think many (including myself) still had reservations about these systems and even though I appreciated the ease of which I can place the bets and achieve better than the advised prices, I didn’t go overboard with my stakes on these bets last season. Hindsight is a wonderful thing and I really wish I’d gone to town on these systems now, especially given the UK results! 

Here’s the results for last season:


10 of the 11 systems were profitable, the overall results of all systems was very good but more importantly, both algorithms did very well. 6.8% and 8.2% respectively for profits of the algorithms is very good and therefore, it’s hard to not be impressed by these results.

The filtering between system E2 and E3 was rubbish and this impacted E3-E6 and E3-E7 but overall, it is hard to be too critical.

E1-E6 and E1-E7 had exceptional years and really managed to build on the profits from the first year these ratings were live (second season of Euro bets).

If we look at the last two seasons when these rating algorithms were live, here’s the combined results:


Although it’s still early days and my comments are similar to the UK Draw systems, these results are pretty good. Both algorithms look solid, the combined systems look solid, especially E1-E6 and E1-E7 and I think as we go into the 3rd season with these algorithms, there is going to be an element of expectation now.

I think having written the UK Draws and Euro systems reviews now, it’s safe to say that as TFA goes into its 6th live service, it is no longer predominantly a service specialising in the UK leagues for outright bets. It has systems with great potential for UK Draws and we have the Euro bets with a couple of seasons of proven results behind them. This isn’t a bad place to be in.

For the record, here’s the results for the first 3 seasons which are not really meaningful when looking forward but of course, this is the proofed results for these Euro systems:


Even with the very poor first season included, these Euro system returns are starting to stack up I think. Roll on next season! 

Friday 26 June 2015

UK Draws Season Review 2014/15

I think the most difficult systems to review this Summer are the UK Draw systems. This was their 2nd live season and the results in the first season were very impressive on most of the systems. As I alluded to last Summer, the results were even better when compared to the underlying draw strike rates in the UK leagues and the 2013/14 season was the lowest strike rate for draws since the 2007/8 season. Therefore, to produce these results below in the first season of live results was impressive to say the least:


I think coming into last season, I probably had in the back of my mind that the UK draw systems were possibly my best systems. Yes, they didn’t have anywhere near the profits or number of bets as my other UK systems but given they had only been live for 1 season, you had to look beyond this. My assumption was that the 2014/15 season couldn’t be any tougher than the 2013/14 season and therefore, if the underlying results were a little easier, the profits should improve and we would have a serious set of systems on our hands after 2 seasons.

Unfortunately, the strike rate was draws in the season past was the lower than it was in 2007/8! A strike rate of only 25.3% last season makes it the toughest season for draws since 2006/7 and one of the toughest seasons for draws you could ever expect I think. Therefore, any plans of the UK Draws having a great season last season went out of the window quite early on as they got themselves into a bit of a hole and at one stage, break-even looked a helluva long way away from being achieved. However, the systems ended the season well as the strike rate picked up a little in April and the results for the season were:


Overall, these results are disappointing and seeing 5 of the 11 systems making a loss over the season means it can never be a good season for the systems. However, when you consider the underlying results produced a strike rate of 25.3% for draws, then it is a positive that every system managed to beat this strike rate and although they couldn’t turn it into a profit on every system, having 5 systems in profit is not easy when the results are so tough.

I think the most pleasing aspect of these results is the fact that both algorithms made a profit independently. System D6 made an ROI of 5.8% over the season to Pinnacle prices when the P&L to best draw prices was a loss a loss of over 6%. In my opinion, this is probably the best result of any system I’ve ever had over a season. It was very tough to break-even over the season but to make a profit of this magnitude is an amazing performance.

Although system D1 wasn’t anywhere near as impressive, to make a profit of 1.7% is acceptable in a season like this and I think both UK Draw algorithms outperformed the other UK algorithms by a long, long way. The only thing that stops these algorithms being hailed as the best last season will be the performance of the Euro algorithms as we’ll see when I review these systems.

The filtering on systems D2 & D3 and D7 didn’t really work well last season but being honest, it’s hard to be too critical given the underlying results.

The combined systems were nowhere near as impressive as the first season although I think seeing D1-D6 hit a 4.6% ROI in a season as tough as this, combined with the results in the first season means this system is potentially very, very good. I look forward to seeing what this system can do when the underlying draw strike rate increases by a 2%-3% like previous seasons.

If we look at the results of both seasons combined, here they are:


I’ll start with the positives first. After 2 very tough seasons for draw bettors, these results are pretty good I think. Yes, none of the systems are statistically significant and it’s too early to be putting all our eggs in one basket with these systems but given the underlying results so far, I think these results are exceptional.

Both algorithms are doing as they are intended to do and are making a small profit over a large number of bets. A 2.7% and 3% ROI respectively won’t make you rich but if you can turn 5%-6% losses for underlying results into a couple of % points profits to Pinny prices only, you have a great base to work from.

The filtering from system D1 to D2 works exceptionally well at the moment. The filtering from system D2 to D3 is about as bad as you could do! To turn a 12.9% profit on D2 into a -5.6% loss on D3 takes some going!

The filtering from system D6 to D7 is pretty good although not as good as moving from D1 to D2.

The real power of these systems appears to be in the combined systems though. Systems D1-D6 to D2-D7 have now built up very good results over 2 seasons and if the underlying results can just get a little bit easier over the next few years, the results for these systems could be even better I suspect.

Systems D3-D6 and D3-D7 obviously suffer badly from the results with system D3 and therefore, I don’t think these systems add anything to the other systems.

Overall then, still early days for these UK Draw systems but two seasons in, I’m really pleased with these results. Yes, I would have hoped for a better season last season but given the underlying results, we’ll accept these results and move onto next season with a fair degree of confidence.

Summer Actions – System D3 and Systems D3-D6 and D3-D7 will be retired. I don’t see the need for these systems going forward. Not sure they add anything to my proofed results and the turnover on the systems is far too low anyway. I don’t plan on touching these systems too much over the Summer. I’ll take a look at them and see if any tweaks could be applied but I’m never a fan of touching something that isn’t broken or even appears to be on the decline. I’m not sure we’ve seen the best of these systems yet. 

Tuesday 23 June 2015

Misc Systems Season Review 2014/15

The 3rd set of systems to review this Summer is the Misc Systems. As the name suggests, these systems are a bunch of misfits and were cobbled together at the start of the second season of the service to see if I could improve up on the returns on the other systems at the time, the Est Systems and the 3 New Systems (31-33). To recap, the systems are made up of:

6-32 – any bet that appears on system 6 and 32
21-31 – any bet that appears on system 21 and 31
6-21-31 – any bet that appears on system 6,21 and 31

The rationale for the 3 systems above was quite simple. It was another method to try to filter the bets on the higher turnover systems. Ideally, we would reduce the turnover, increase the ROI and we would have another system that could be followed.

The final 3 systems were a little bit different. These systems were based on a method known as a ‘Similar Game Method’ and simply involved building rules looking for particular types of bets. For example, backing the teams in 21st-24th place in League One every season when they play away from home is a profitable strategy. There are a whole host of rules I have built which are based on historical results which are profitable. When the bets were thrown up using these rules, the bets were then cross referred with either system 21, system 6-21 or system 31 and this created 3 new systems.

TOX – SGM bets which appeared on system 21
STOY – SGM bets which appeared on system 6-21
STOZ – SGM bets which appeared on system 31

If anyone looks closely, there will be the odd bet that appears on TOX for example that isn’t on system 21. It will be a bet where system 21 had it as value but the bet was dropped due to an odds restriction. Hence, it isn’t on 21 but is on TOX.

Again, the purpose of these 3 systems was to provide another slightly different method to cross refer the bets but of course, the correlation to systems 21,6-21 and 31 was basically 100%.

Over the first 3 seasons these 6 Misc systems were live, the results were:


As you can see above, 5 of the 6 Misc systems were actually very profitable over the first 3 seasons and although the results weren’t as impressive as some of my other systems, they were still very good. I took some additional comfort from the methods used to create these systems and for example, for one of the SGM systems to lose, they needed the underlying rules to lose as well as the system it was cross referred with losing. Hence, it sort of felt like these systems were a little protected from a downturn, more so than some other systems. Likewise, for systems 21-31 or 6-21-31 to lose badly, it needed two or three algorithms to perform badly. Given I had never had a losing algorithm over a season, surely I couldn’t hit 2 or 3 algorithms losing at once?

It’s always nice setting the scene, showing the thought that went into things and then boom, a season like last season comes along and the results for the 6 systems were:


I’ll start with the positives first. Systems 21-31 and 6-21-31 didn’t have a losing season even though systems 21 and 31 had a nightmare season. This shows the strength of cross referring systems and although these systems didn’t perform as well as the individual systems did during the good seasons, during a downturn, the cross referral of the systems has helped reduce losses. Therefore, the rationale for cross referring the systems was correct and therefore, in a season of few positives, anyone following these 2 systems did OK.

Ignoring that positive (says it all that just better than break-even over a season for a system in a positive!), we have the performance of the other 4 systems. I’ll deal with system 6-32 first.

A loss of 12.4pts isn’t a disaster but being honest, the system wasn’t doing that great coming into the season. Over 4 seasons now, the system has generated a profit of 8.3pts at an ROI of 0.9%. That’s nothing and put it down as one of the worst performing systems since inception of the service. This service will now be retired and we won’t see 6-32 in future. It isn’t any better than system 6 or system 32, so no point having it!

Right, the 3 SGM systems.

I’ll start with STOY. A loss of 13.3pts at an ROI of -3.7%. A poor season but given the previous results, it isn’t a disaster. The overall returns for the 4 seasons now stand at 68.4pts at an ROI of 5.6%. Hence, the system lost about 16% of the profits it had made previously which although disappointing, isn’t a disaster.

Unfortunately, the other two systems were a complete and utter disaster. TOX lost 28.7pts at an ROI of -7.2% and STOZ lost 41.8pts at an ROI of  -7.9%.

TOX is cross referred with system 21 and we know system 21 lost 1.5% last season, so the SGM system rules made things much worse. The same is true for STOZ as we know that system 31 lost 2.6% and therefore, the SGM rules have had a nightmare.

I don’t have time at this moment in time to run through all the rules and check the individual P&Ls but I think it’s probably not too surprising. We already know last season wasn’t like the previous 4 seasons in terms of the results for my ratings and given my ratings are based on historical results, it all points to last season’s results being a little bit different from previous seasons. Of course, one issue with using a SGM approach is that if something changes and the historical results aren’t an indicator of future results, then an SGM approach will really suffer. Probably more so than my ratings as my ratings are much smarter than just applying basic rules based on historical trends and results.

Being honest, I had never really thought about this until I spent time looking at the SGM results but in a way, I quite like the fact these systems have bombed massively last season now. Yes, it’s cost me a small fortune (I followed STOY) but it sort of helps me understand why my ratings struggled so badly last season. It’s impossible for me to exactly pinpoint where it went wrong last season (we know it wasn’t the underlying results as the number of Aways/Wins/Draws was in tolerance) but clearly, something happened last season that hasn’t happened previously.

I guess the question for all of us and what we want to know is will next season follow last season and we’ll lose again or will it revert back to the long-term trend?

I’m not really ripping into the systems here as although they created massive losses and performed miserably, I sort of understand why. Systems and ratings are only as good as the data they are based on and if something material changes in the data, the systems and ratings will fall into a hole.

I will obviously rebuild the SGM rules which will hopefully help the performance of these systems in future but I now have my own reservations with these systems now. If we can’t be confident that the past will help predict the future, then the first systems that will fail are the SGM systems I suspect. After last season, I would be worried about following these systems blindly in future although if we see last season as a blip, then there are no worries.

This review is fairly short but anyone who wants to play around with the performance by league etc. can do so in the spreadsheet I provided.

Here’s the updated results for all 6 systems after 4 live seasons of results:


Summer actions – System 6-32 is now retired. I will rebuild the SGM rules for the 3 SGM systems but apart from this, I think it’s a case of waiting to see what happens next season. I wouldn’t touch 21-31 or 6-21-31. I think both these systems are now two of the strongest systems I have as they have never had a losing season even though last season was a disaster! If they can get through last season without a loss, I suspect they can get through any season without a loss! 

Friday 19 June 2015

New Systems Season Review 2014/15

If we thought it was a poor season for the Established Systems, this review is going to make even worse reading. Going into the season, I would say this set of systems probably carried more weight than any other set of systems in subscriber’s portfolios and betting strategies but these systems crashed and burned badly this season.

These systems have always been a little bit of boom and bust since their inception and this was the 3rd season that all systems had been live. Systems 31-33 have been live for 4 seasons. The first season all systems were live wasn’t great, the second season was amazing and the 3rd season has been poor. Overall, the results don’t look too bad although they now lag a little behind the Established Systems.

Going into this season, system 31 looked like the best system I had and probably one of the best systems I’d ever seen with 3 season’s of live results behind it. Roll on another season and the results don’t look anywhere near as impressive after a very poor season. Half way through the season, System 31 hit the magic <1% P-Value and I thought, finally, a system that is statistically significant. It barely hit a winner after this!

Here’s the results for the 3rd algorithm (system 31):


A poor season for this algorithm as discussed above. A loss of 24.5pts from 943 bets for a -2.6% ROI. Looking at the breakdown by value, all the profits were generated in two bands. Bets less than 10% value lost 33.5pts ( low value bets were profitable historically unlike the other algorithms) and the bets with more than 20% value lost 21.4pts. The sample sizes for the higher value bets were very low but it is these bets that historically, have really made the difference on this algorithm as we’ll see later. Only hitting 1 winner from 20 bets at 25+ value is a killer although the ave odds are pretty high as you can see.

Unlike the first two algorithms, the low value bets didn’t do well and I find it slightly annoying that on the first two algorithms, low value bets were great and were terrible historically and yet on this algorithm, low value bets did poorly and yet, were profitable historically. Very irritating!

If we look at the results on this algorithm since inception, we can see how annoying these results this season are:


I guess if I was data mining, I could say that the value band 25%-30% has struggled since inception and last season’s losses aren’t a great surprise but the highest value band usually does very well.

Since inception, the overall algorithm has generated a profit of 4.3% even after last season and therefore, it is obviously very disappointing to see a losing season.

Here’s the results of this algorithm for the past 4 seasons, side by side:


I think this picture reiterates the fact that seeing a losing season for this algorithm is very disappointing. The first season wasn’t great by any means but still a helluva lot better than a loss. A 10% ROI two years ago was maybe the best performance I’ve ever seen by a rating algorithm over a season. To go from this to a loss in two seasons is very disappointing.

You could potentially point to the increased bet number as a mitigating factor for the deterioration in performance but as I said with the previous review, I don’t think the increased turnover is to blame for the poor results. Always impossible to prove this but nothing was done to the ratings to worsen the expected performance going forward.

Here’s the Home & Away split for last season:


Homes were slightly better performers than Aways last season but overall, both lost money.

Here’s the same split since inception:


Again, similar to everything else last season, the results didn’t match the historical results. Aways have been the most profitable bets historically and these were the worst bets last season.

Going into the season, the best performing league on this algorithm was the Championship by far. Of course, 437 bets wasn’t a big sample but even so, an ROI of 16.3% was impressive and if I was having to bet on a league performing well on an algorithm, the Championship on algorithm was nailed on. Here’s the results before this season:


Amazingly, the P-value for the results in the Championship was 2% going into the season. Here’s the results from last season:


Well, you can obviously guess but the worst performing league was of course, the Championship. A loss of 25.7pts when on average, the league was making 25pts a season before last season! Grrrr….

I think as always, these sample sizes are small but it shows the difficulties people have with trying to draw conclusions by league or by any other factor they may use to filter bets. It isn’t easy and in any season, I honestly believe the results are going to be random and will bear little resemblance to historical trends.

Overall then, a first losing season for algorithm 3 although at one stage last season, it looked like the algorithm would make a profit. The wheels fell off mid season and never really recovered if I’m honest.

Going forward, there will obviously be doubts about this algorithm now and I think they are justified. However, one poor season can’t undo the work of the previous seasons and it’s important this lost is kept in context. I’ll tweak a few things in the Summer to try to improve the algorithm and check the changes made last Summer didn’t impact the performance negatively.

Here’s the results for the 4th algorithm:


Not much to say here apart from this algorithm isn’t very good. Coming into the season, it was definitely my poorest performing algorithm and nothing last season made me change my mind. If anything, these results reinforce the fact the algorithm isn’t very good.

Annoyingly, the bets that made a profit were the bets with less than 5% value. Here’s the results coming into the season:


If there was one value band on any algorithm I wouldn’t have touched with a bargepole, it was low value bets on algorithm 4. What happens? This is the value band that makes 12.1pts profit, the other value bands made a loss combined of 65.5pts from 372 bets! Terrible.

Here’s the updated results for the algorithm since inception:


Even after last season’s disaster, the algorithm is still pretty much break-even after 3 seasons and 2,639 bets. Although it’s disappointing it hasn’t performed better, it’s not a total disaster and if you were filtering the bets from system 41, you are at least starting from a break-even position. There is clearly no edge here though as things stand at the moment.

Given I basically rebuilt this algorithm last season on the same basis as the previous algorithm, it’s clear that this method no longer works. If this algorithm continues, it needs a full rebuild again and probably ignores any previous method or rules for this algorithm. Not sure I have the appetite to do this!

Over the last 3 seasons then, here’s the results:


Not much to say, even when the algorithm performed well, it was still rubbish!

Not going to show any more tables for algorithm 4, not much point really given the poor results. Any members can do this for themselves using the spreadsheet.

So, looking at the results for both algorithms, it’s hard to imagine the other system results being much better. Here’s the filtering on algorithm 3:


Basically, the filtering made very little difference on algorithm 3. The results were similar for all 3 systems and basically, the filtering didn’t make things better but didn’t really make things worse either.

Here’s the results since inception:


Interestingly, we can see clearly that system 32 and system 33 don’t improve things at all. If anything, they make things a little bit worse in terms of the results. Therefore, there is little point in having these systems.

Did system 42 rescue the 4th algorithm? Here’s the results this season:


In a word, no!

Here’s the results since inception:


Same story here, system 42 adds nothing to system 41.

Based on these system results then, we already know the combined systems aren’t going to look great. Here’s the results for all 11 New Systems this season:


A terrible set of results all round. I guess the only plus point is that the cross referring of the systems ensured the overall impact of systems 41 and 42 were reduced somewhat but even then, if you cross refer two losing algorithms, it’s impossible to do well.

System 33-42 somehow made a profit even though systems 33 and system 42 were terrible, so it shows you can actually make a profit cross referring losing systems but it’s easier to do that with lower turnover systems. Trying to do it with higher turnover systems is much more difficult.

Here’s the same results since the inception of these systems (have to split it in two since systems 31-33 been alive for an additional season):


Overall, the returns from most of these systems have taken a significant hit after last season and therefore, all these systems are now under the microscope I think. I think it’s clear that systems 32,33 and 42 don’t improve the returns on either 31 or 42 and therefore, not sure what the point of having these systems is. The filtering doesn’t work and therefore, there is no need for these systems.

My only concern with scrapping them is that they are used by some people for various methods of filtering the bets but I suspect that next season, these won’t be official systems in the proofed results. They will be retired!

Overall, a really poor set of results and it’s a shame that these systems have had such a poor season after a solid start for a few seasons. I need to think long and hard about what I do with these systems and whether or not they all continue (unlikely) and if I drop some, they need to probably still highlight the bets they would have had for people using the number of times a team appears as a filter.

Summer Actions – Decide what I do with this whole bunch of systems. 31 is the only system that is guaranteed to continue next season although it’s likely I’ll do a deep dive on the rating algorithm to see what I can do. Not sure about system 41 or any of the other systems 32,33 and 42. Something needs to be done though! 

Friday 5 June 2015

Est Systems Review for Season 2014/15

Similar to previous seasons, I’m going to review all the various sets of systems, one at a time. It can become quite boring writing and reading this stuff if I’m honest but as always, I’ll try to highlight anything that I find interesting and potential things we can look out for going forward.  I’m going to work from the spreadsheet I sent out to all members at season end which is called “TFA live results to end of 2014-15 season”. This way, anyone reading this with access to the sheet can recreate any of these tables themselves. Usually, I work from my own results sheets I have which contains results for each set of systems and has some formatting applied to it but I quite like this new sheet I’ve created and I like the idea that anyone using the sheet can see these tables for themselves.

So, this review will look at the performance of the first two rating algorithms (sys 6 & 21) for the season as well as the 11 Est systems. I’ll also look at the latest live results to date and make some commentary on these hopefully.  As always, I’ll try to summarise at the end and hopefully provide some sort of conclusion.

Here’s the results for this season for the first rating algorithm (system 6):


Not a fantastic season by any means but a profit of 10.8pts from 808 bets, an ROI of 1.3%. At a high level, a solid enough season for this rating algorithm although as we will see, trying to filter the bets on this algorithm proved very difficult. 

We can see from the table here that the value ratings didn’t really work at all. There were 650 bets with a value % of less than 10% and these did very well, generating a profit of 29pts at an ROI of 4.46%. I think this is about as good as you can expect from these bets and I would say they hit the target this season.

The issue with this algorithm (it will be a common theme across reviews) is that the bets with a value of >10% lost 18.2pts from 158 bets. This is ultimately the issue with this algorithm this season and unfortunately, for whatever reason, these bets have underperformed massively this season.

If we look at the results since inception of the algorithm (value ratings were not shared prior to the 2013/14 season), then we see that this trend last season is not common across the value bands:


Since inception of the algorithm, even with last season’s good returns in the lower value band, backing all bets with less than 5% value has not been profitable. Backing all bets with a value of at least 10% has generated a profit of 5.5% which although below expectations, is acceptable. Therefore, seeing a loss of over 11.5% last season is disappointing.

One of the aims last Summer with this algorithm when I was refreshing the ratings was to try to increase the bet number a little and as the below table shows, this was a success.


However, what I haven’t managed to do (which was my aim!) was to reverse the downward trend on the ROI. The ROI has been declining each season since the 2011/12 season and although I refreshed the algorithm last Summer, I didn’t actually manage to improve on the returns. Now I’ve seen the underlying results and the fact that last season wasn’t too tough overall, I’m disappointed by the returns from this algorithm (about to become a common theme I think during the reviews!).


Homes were slightly more profitable than Aways but interestingly, both Homes and Aways were profitable.


Looking at results since inception, Aways are twice as profitable as Homes which is down to the risk/reward I suspect of the higher odds.

Overall then, not the greatest season by any means for this algorithm but considering the performance of the other 3 algorithms, this was my best performing UK algorithm (ignoring the Draw algorithms). The worry is the clear downward trend on the ROI and if this continues, we’d probably be looking at a losing season next season. Saying that, making a profit 5 seasons in a row for any football algorithm is not easy and therefore, it needs to be applauded for this at least!

Here’s the results for the second rating algorithm (system 21):


A loss of 12.2pts from 812 bets. An ROI of -1.5%. The first losing season the algorithm has had since inception.

A similar story to the first algorithm in the sense the value ratings are all over the place. Coming into this season, the lowest value bets were loss making over the previous 4 seasons but this season, the lowest value bets somehow created a profit of 17.3pts at an ROI of 3.5%. Very good and probably better than I would expect given the value % for these bets is between 0%-5%. However, all other bets then with a value % of 5%+ made a loss of 29.5pts from 322 bets. An ROI of -9.2%. Very, very poor.

Here’s the results since inception for this algorithm:


Same sort of story as algorithm 1. Bets with less than 10% value have generated a profit of 18.7pts from 1,590 bets over 5 seasons. Bets with more than 10% value have generated 122.2pts from 1,322 bets. Nothing in these results would lead me to believe that we would have suffered losses from the over 10% value last season. Variance is probably at play due to the low bet numbers.

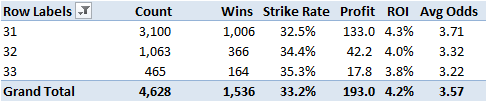
Here’s the results over time for this algorithm:


One of the big changes this season as a result of the tweaks last Summer was the increased bet number. Great that this algorithm now has more bets as it wasn’t generating enough bets but unfortunately, the P&L has probably been impacted by the changes too. I’ve let too many bets sneak onto the algorithm that haven’t been profitable last season and therefore, the challenge I guess is to try to refine the algorithm again this Summer to reduce the bet number a little but increase the ROI.


Unfortunately, Aways were poor and a loss on Aways caused the issues for this algorithm.  
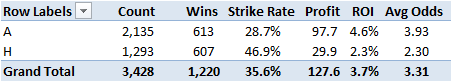
Here’s the results below since inception:


Again, the results since inception don’t back up what we saw last season and Aways have generally been the strongest bets on this algorithm since inception.

Overall then, both algorithm’s performance last season was below par, more so on algorithm 2. Unfortunately, the algorithms didn’t perform like they did in previous years although how much of this was down to the increased turnover on each algorithm is unclear. Even so, as I said last Summer, none of the changes to the algorithms were expected to reduce profitability and therefore, I wouldn’t put any blame of the underperformance on these tweaks last Summer.

So, if it was impossible to filter the rating algorithms using the value ratings, how did the system filtering do last season? Unfortunately, it was a similar story.

Here’s the filtering on the systems on algorithm 1 for last season:


A nightmare really for these systems and as you tried to filter the bets, it became worse and worse. System 7 made a 9.1% loss which is very poor considering the fact system 6 made a profit and system 8 did even worse and managed to make a loss of 13.3%. A very poor performance and the last couple of seasons have been similar.

Here’s the results for the filtering of these systems based on the first 3 seasons of results:


A perfect example of how I hoped the filtering would work on the systems and as you reduced the bet number, the ROI increased and for those that wanted to reduce the bet number by using higher system numbers, the strategy appeared to be working well.

Here’s the same results for the last 2 seasons only:


Quite amazing how badly the filtering has worked for the last two seasons and therefore, I have massive question marks over whether or not system 7 & 8 should continue next season. At the end of the day, if the systems aren’t adding anything to system 6, then what is the point in having them.

Based on the last two seasons, you could use system 7 as a filter on system to weed out the worst bets on system 6!

Here’s the full picture for the last 5 seasons:


Based on this, you have to say that dropping system 7 and 8 wouldn’t be the worst idea. If you use system 7 as a filter on system 6, you end up with system 6 improving its ROI and reducing the bet number. You end up with 2,287 bets and a profit of 124.5pts. An ROI of 5.4%. The unfiltered ROI is 3.7%. Hence, you can increase the ROI on system 6 by 45% by excluding all system 7 bets!

The crazy thing is that after the first 3 seasons, it’s hard to think this strategy could have possibly have worked the last two seasons. Whatever worked for the first 3 systems on this algorithm has stopped working for the last two seasons.

Here’s the filtering on the systems for algorithm 2 for last season:


A similar story to algorithm 1 where the filtering has actually worsened the performance of algorithm 2. A 5.5% loss on system 22 compared to a 1.5% loss on system 21.

If we look at the first 4 seasons this algorithm was live (rather than the first 3 as the filtering worked fine last season), we have the following performance:


As you can see, the filtering has worked perfectly well up until this season and the ROI increased from 7.3% to 12.3% as you moved from system 21 to system 22.

More importantly, system 22 in isolation had looked a very good system until last season and here’s the returns by season for this system:


Again, I’m not sure I could have predicted system 22 would struggle this season. It looked one of the best systems although as always, sample sizes were small and therefore, there was no guarantee there was any edge here at all in the previous 4 seasons.

I think unlike system 7 & 8, there appears to be good rationale for continuing with system 22. It actually adds a fair bit to the performance of algorithm 2 and I think I would happily write off last season based on the fact that the previous 4 seasons were very good. More difficult to do this for systems 7 & 8 given it has happened 2 years in a row on these systems.

So, we have seen that filtering the algorithms based on value ratings didn’t work this season (worked previously) and we have now seen that filtering systems didn’t work either last season (worked previously). The last place to filter bets is obviously using the combined systems and hoping to improve the performance of the basic algorithms by cross referring the systems.

Here’s the results for last season for the 11 systems in total:


Overall, a loss of 118.4pts from 3,604 bets and an ROI of -3.3%.

Clearly, systems 7 and 8 are responsible for a large part of the losses as it has a knock-on impact on the combined systems.

Systems 6-21 and 6-22 had disappointing seasons but being honest, the results weren’t that bad at all. Same comment probably goes to system 7-22 and 8-22 although these did have poor seasons. Systems 7-21 and 8-21 had an absolute nightmare of a season and anyone following these systems would have struggled badly.

These systems have obviously been around since the inception of the service. Here’s the updated live results after the season past:


I think now we have 5 seasons of worth results, we can draw our own conclusions.

Going back to what I said earlier in this review, I’m not sure what system 7 or system 8 adds to the party. Clearly, the filtering from system 6 using these two systems doesn’t work well enough at all. I either need to look into this over the Summer or I simply need to drop system 7 & 8. Of course, dropping 7 & 8 would mean dropping 7-21 thru to 8-22.  Looking at the results, I’m not sure I would like to drop systems 7-21 thru to 8-22. I know one person who has followed system 7-22 since inception with a little tweak applied and I’d probably lose this member if system 7-22 was removed!

I have always been a fan of following system 6-21 rather than just following system 6 or 21 and I think this table backs this up.  System 6-22 is also an improvement on system 22 and therefore, this justifies having system 6-22 in the portfolio.

Given the fact that systems 7 & 8 are poor, you really need the cross reference with 21 & 22 to achieve any sort of meaningful return. Therefore, if you are going to keep system 7 & 8 going, you really need to keep 7-21 thru to 8-22.

Overall then, a poor season for these systems but long-term, the results still look OK. I guess the question is around whether or not I can improve on the algorithms and base systems in the summer to hopefully try to stop the slide on the returns over time. Another season like last season and I suspect these systems are dead (and the service likewise!).

Summer Actions – Look to do some form of re calibration on both algorithms over the Summer to hopefully increase ROI whilst at the same time, looking at the 10 base systems that sit behind systems 6,7,8 and possibly look to improve these if possible. Not sure if I will look at the base systems on algorithm 2 or not, will see how much time I have this Summer.