This is going to be the first in a series of reviews of
the various systems from last season. I think the biggest change from previous
Summers is the fact I intend to review a set of systems all at once, rather
than individual systems or subsets of systems. I think the advantage of this is
that it allows us to see all systems side by side for that particular group of
systems and therefore, comparisons can be made quickly.
I’ll be doing 6 reviews in total:
Established Systems
New Systems
Misc Systems
Draw Systems
Euro Systems
Under/Over Systems
I think the Est Systems and New Systems are the most
interesting for me personally given how much the systems struggled this season
compared to last season. I expect these will take the longest time to produce
and will probably contain the most words.
We then have the Misc Systems which also struggled over
the season but I’d seen this before in their first season, so it wasn’t so much
of a surprise. The Draw systems will be interesting to review as they seemed to
outperform the underlying results by a long way this season which bodes well
for the future I hope. The Euro systems had a much better season compared to
last season although I expect the low draw strike rate may have helped these
systems this season. The Under-Over system review will be a short review as
these systems will be discontinued going forward.
Review of Established Systems for Season 2013/14
I think the obvious place to start is the results by
system for the season. Here they are:

A profit of 23.3pts from 2,155 bets gives an ROI of 1.1%.
The results by system were very volatile by system as quite simply, the
filtering on the first algorithm didn’t work at all. System 6 made a 3% return
which is a decent base to start from but system 7 took 148 of these bets and
made a loss of 10.6%. System 8 improved on this a little and only lost 5.6%. A
very disappointing season really for systems 7 and 8 considering the returns on
system 6.
Algorithm 2 performed much better and a profit of 11.9pts
(2.6%) on system 21 became a profit of 21.9pts from 94 bets on system 22. A
highly impressive ROI of 23.3%.
Before I get onto the combined systems, it’s worth
looking at the AH returns as I think this helps to explain the underperformance
of system 7 and 8 this season. For systems 6,21 and 22, the AH returns are much
worse than the outright returns and therefore, the draw didn’t impact these
systems too much this season. However, it’s not the same story on systems 7
& 8. System 7 made a loss of 15.7pts if backing outright but if using
AH0.5, it became a profit of 7.7pts! Less so on system 8 but the loss was
extinguished at least.
A few people have asked over the past few seasons why I
track performance of AH returns as well as outright betting but quite simply,
it’s due to this reason. During the first season, the results of my ratings and
systems dropped off a cliff at a point in time and I struggled to understand
why. I guess this was before I really understood how the underlying results
impact my returns and therefore, I decided to track AH returns. When
your systems are making positive returns at AH0.5 and large losses for outright
betting, it points to the draw being a pest.
Clearly, the draw has been a pest this season on systems
7 and 8. On system 7, 53 of the 148 bets this season have been a draw. That’s a
strike rate of 35.8%. If placing 1pt on every game on system 7 to be a draw
this season, it would have generated a profit of 38.69pts from 148 bets. An ROI
of 26%. System 7 would have been my 2nd best Draw system this season and yet, my Draw
systems have had a great season! :)
I guess the question everyone wants answered is…..why?
Why has system 7 suddenly hit the skids this season? Well, I don’t have the
answer to this I’m afraid. In a way, I would have preferred system 7 to have
made massive losses for all types of returns and for the draw not to be to
blame as then, it becomes quite easy to say that the filtering hasn’t worked
well. However, when the bets aren’t winning but they are drawing, it becomes a
very thin line between success and failure. 148 bets is not nearly a big enough
sample and ultimately, that’s where the issue lies with system 7 and system 8
(and some of the higher combined systems). When you have so few bets, if you
are impacted by a bit of bad luck, a few teams losing late goals who would
ordinarily have won, it suddenly skews your results massively for a season.
I guess the best test for system 7 and 8 will be the
overall results. 4 seasons of results is a much bigger sample and luck tends to
even itself out over a bigger sample of bets. We’ll look at the overall live
results later in the review.
Having seen these results for the single systems, we
already know how the combined systems will look. Any combined system involving
system 7 and 8 is going to be a mess this season. I think this is reflected in
the results we see. System 6-21 didn’t have the best of seasons and only
achieved a 2.9% return (disappointing considering the returns on 6 and 21) but
system 6-22 obviously benefitted from system 22 having a good time of it this
season.
I guess the issue this season lies with systems 7-21 thru
to 8-22. All 4 systems made a substantial loss and therefore, this has to go
down as a massive disappointment. It is actually quite scary that system 22 had
94 bets and a profit of 21.9pts but system 7-22 ended up with 49 of these bets
and an 11pt loss! Clearly, system 7 had a massive influence on this and the AH
returns for all 4 combined systems 7-21 thru to 8-22 were better than the
outright returns.
Clearly, algorithm two had a good season, algorithm one
had an OK season but the filtering between system 6 and 7 is impacted by draws
and yet, this translates into a large loss on systems 7-21 thru to 8-22. This
is the crux of the issue on these systems this season. The fact that some
people followed all 4 systems at the same time means they have taken a small
issue (too many draws on system 7) and compounded the issue MASSIVELY,
resulting in crazy losses and a nightmare scenario.
We all need to learn from this and we need to ensure we
don’t end up in a position whereby if one little thing goes wrong like a system
hits too many draws in a season, it suddenly follows that we’re going to lose a
massive proportion of our betting bank. I’m fed up using Steve (daily 25) as an
example but his returns this season show what can happen if you follow a sample
of bets whereby the returns and risks are cumulative.
I think if someone had offered me a 3% return on
algorithm 1 and a 2.6% return on algorithm 2, I would have accepted this at the
start of the season. It’s a great base to build from and after this, it becomes
a case of trying to filter the best bets if you don’t want to follow all bets
on system 6 or 21.
I think the hardest thing about the season for these
systems has been the distributions of returns by month. Quite simply, the
systems have been loss making from day one and that alone always makes things
feel much worse. Here’s the returns by month:

A 92.4pt loss in September, followed by a 33.5pt loss in
October meant the systems were down 125.9pts after two months. Not the start to
the season you ever hope for! I think the fact the systems made a profit of
149pts from 1,553 bets over the next 7 months shows there isn’t too much wrong
with the systems. I think the galling thing for me was that before March
appeared, I was confident the systems would have had an OK season overall.
However, March put paid to that and even though April was better than anyone
could have expected, the season still was well below par.
If I had been offered this season at the end of October,
would I have taken it? Yes, without a doubt. I was sure the systems would have
made a loss this season at the end of October (even if I was putting on a brave
face!) and therefore, I have to be happy with where it ended up.
I think the next step of this review is to put the season
results into the overall live results and take a look at these. At the end of
the day, this season is only one season out of four live seasons for these
systems and therefore, if we want to draw any conclusions, we should look at
all live results to date. Here they are:

Given the results these systems have had this season,
it’s somewhat reassuring for me to see the overall results again! I’m fed up
looking at losses on these systems. :)
I guess what we want to ask ourselves here is if there
are any major issues with the ratings, the filtering or the combined systems. I
tend to ask myself that each Summer for each of my sets of systems.
If we take the ratings first, algorithms 1 & 2 now have
returns of 4.5% and 7.2% respectively. Given this is over sample sizes of 2.6k
and 2.1k bets, it’s safe to say I’m happy these algorithms have an edge.
Algorithm two looks stronger than algorithm one though and to be fair to
myself, I’ve been saying that since I first developed the algorithms. I learnt
a lot from building algorithm one and therefore, I was always confident
algorithm two would prove more profitable long-term. I think we have seen that
come to fruition now.
In terms of the filtering, I think this is where there
appears to be an issue. In an ideal world, what we want to see is that as we
move from each single system to the next system, we see an improvement in ROI.
Probably easier to start with system 21 and moving to
system 22. This looks perfect and clearly, the filtering between system 21 and
system 22 is working very well. A 7.2% ROI on system 21 becomes 12.3% on system
22. This is exactly what I’d be hoping for and the fact it worked so well this
season is just another sign that everything is working as expected.
If we look at system 6 to system 7 then, clearly, the
impact from this season can be seen and what we see is a lower return on system
7 than system 6. Looking quickly, we can
see that system 7 is the only system where the AH0.5 returns are greater than
the outright returns. On every other system, the AH0.5 returns are a fraction of
the outright returns. Clearly, system 7
is catching more than its fair share of draws.
3.2% ROI over 869 bets on system 7 is probably about as
low a return as I would expect. I think this means we now have a massive doubt
over system 7 going forward and ultimately, I would place system 7 (and systems
7-21,7-22) on the watch list for next season.
Looking at systems 7 to 8 then, we move from a 3.2%
return on system 7 to a 8.4% return on system 8. Again, I think this is highly
acceptable for the filtering and there doesn’t appear to be too many issues
here. My issue with system 8 these days is just the low bet volume and 419 bets
over 4 seasons is not enough turnover. As we saw this season, all it takes is a
few results to not go your way and you end up with a losing season.
Overall then, I think there is potentially an issue with
filtering system 6 but the rest of the filtering appears to work as expected.
That probably leads us onto the combined systems. Does
cross referring the algorithms add anything to the individual systems?
System 6-21 improves on the returns of 6 and 21
System 6-22 improves on the returns of 6 and 22
System 7-21 improves on the returns of 7 and 21
System 7-22 improves on the returns of 7 and 22
System 8-21 improves on the returns of 8 and 21
System 8-22 improves on the returns of 8 and 22
I think some reading this may look at the above and say
that although the ROI improves, the lower bet volume means the combined systems
don’t add as much as it appears and I would agree with this to an extent. It’s
difficult to say whether 6-21 with an ROI of 7.7% over 1,751 bets is that much
of an improvement on system 21 which has an ROI of 7.2% over 2,111 bets.
I personally take more solace from the fact that two
algorithms agree with a bet although as we have seen this season and before,
when too many algorithms and systems agree, it isn’t necessarily a good thing
and you end up with diminishing returns or even negative returns.
I think whether or not someone follows system 21 or 6-21
or system 22 or 6-22 is up to them at the end of the day. I guess if people
believe the 2nd algorithm is much better than the first algorithm,
then what benefit do we get of cross referring with an inferior algorithm?
I have deliberately started with the system results
rather than the algorithm results for the season review. As most of you will be
aware, I always started the monthly review with the algorithm results. I guess
the change in tact is because most people followed the systems and didn’t make
full use of the ratings and therefore, I didn’t want to concentrate too much on
the ratings as people may think I’m deflecting attention from the systems.
However, as I think we’ll see with the rating results this season, there are
some positives to take from the season and it’s how we use these going forward
that will determine the season's learnings I think.
Here’s the results for rating algorithm 1 this season:

I’ve been moaning all season about the fact it’s
dangerous to draw any conclusions from the ratings with the small sample sizes
and to an extent, the same is true here. However, given it’s a season review, I
better put my neck on the line and try to draw some conclusions. We can add the
data this season to the previous seasons and try to draw more concrete
conclusions later.
Looking at these results then, I think the one thing that
stands out is the poor performance of the bets with less than 5% value. I
identified these bets last Summer as a potential weak link on the algorithm and
we have definitely seen that this season.
I guess if I was trying to not be too harsh, I would say that the draw
has clearly impacted these low value bets more than the other value bands this
season but I guess that could be because they are low value bets.
I think the surprising performance is probably the 5%-10%
bets. An ROI of 15.4% is well above expectations for this group of bets.
As we move down the value bands (increasing in value),
then the data gets quite thin and we small losses and profits in each band. The outlier is obviously the highest value
bets. These are never going to be a big group of bets as I don’t believe
bookmakers really make these sort of errors too often but if my value ratings
work as intended, the biggest profits long-term should fall in the 30%+ value
band. This season, we have seen a profit
of 21.1pts from 14 bets for an ROI of 150.9%!
I think over a season, we can’t look too much into
individual bands but I guess we hope to see a pattern of the lowest value bets
making lower profits with the higher value bets making higher profits. We can
see this on the first algorithm.
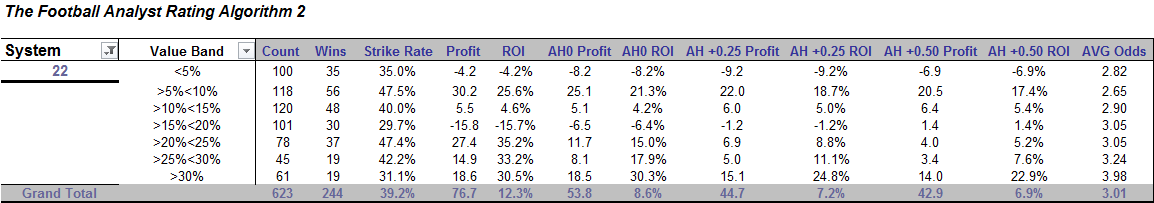
Here’s the results for rating algorithm 2 this season:

If the low value bets stood out on algorithm 1, they jump
off the page here for algorithm 2. A loss of 32.3pts from 200 bets. Wow! To think this algorithm made a profit of 2.6%
and yet, there was a very simply way to improve the ROI massively by just
ignoring 200 bets that appeared on this algorithm!
As we move up the value bands, we can see the data gets
quite thin but the results look fairly decent. The top two value bands achieved
a ROI of 55.7% and 44.6% respectively.
Overall, I have to say the results on algorithm two look
better than algorithm one in terms of the value bands and the returns. I think
the fact the low value bets are so loss making is actually a huge positive as
it means my ratings can split the better value bets out from the poor value
bets.
One thing I haven’t really looked at too much this season
is how the value bets look on systems 7, 8 and 22. Here are the results on
system 7:

As you would expect, the data gets fairly thin but the
point is that the low value bets are still loss making but unfortunately, due
to the filtering that takes place on system 7, many of the high value, high
priced bets don’t make it onto system 7 and therefore, the results aren’t
great.
Here’s the results on system 8:

The data is far too thin here but clearly, the low value
bets don’t improve as we move up the filtered systems and therefore, the value
ratings can’t really be used alongside the filtering of the ratings. I think using the value ratings and the filtering
of the ratings is a step too far based on the fact you’ll have no bets left to
place!
Here’s the results on system 22:

I did find these results very interesting and clearly,
filtering system 21 to 22 actually manages to remove the worst performing low
value bets this season. However, it also removes most of the high value bets
that were profitable on system 21 and therefore, similar to my last comment,
I’m not sure using the filtering of the ratings and the value ratings together
is a great idea.
I think to try to draw more concrete conclusions from the
value ratings, we really need to look at all live results to date. Here are the
results for algorithm one over the last 4 seasons in total:

I think the most pleasing aspect of these results (if you
know what I mean) is that it is clear that the low value bets don’t really
bring much to this algorithm. Over 4 seasons, the bets with a value of less
than 5% have lost 20.8pts from 648 bets.
Here’s the same results for algorithm 2:

Same story again here with a loss of 8pts from 527 bets for the low value bets.
Looking quickly at systems 7,8 and 21, we have the
following results:


All systems experience
a loss for low value bets overall. Therefore, the obvious place to turn
to now is….what would have happened if we just ignored the bets where value was
less than 5%?
Here are the results by season and the overall results
for the 5 single systems by season if we exclude all bets with a value of less
than 5%:

To end this analysis, here’s the results by system over
the first 4 seasons for all bets and the equivalent table for all bets exc bets
where value is less than 5%:


What I haven’t done is bother recalculating the returns
for the combined systems after removing the bets with less than 5% value but
clearly, the returns would improve on all combined systems too.
I guess the obvious solution after seeing this analysis
is just to remove the bets with less than 5% value from the rating algorithms.
I’m not a fan of this as at the end of the day, if you start reducing the number
of bets on the ratings, we can’t tell how good the ratings are at finding value
or understanding the returns of the value bands as we’d have no lower value
bets to compare to. I think the low value bets present a good control group to judge against.
I do think there is clear evidence that if people want to
improve their ROI and reduce their turnover, they can remove lower
value bets from the systems they follow. Of course, it may be the case that
it’s only Home/Away bets that create this loss or it may be certain leagues
where the ratings don’t seem to be as powerful but anyone who can manipulate
data in Excel can look into these things.
Here’s some additional tables looking at performance by
league by season and also splitting all results by season and Home/Away bets.


Again, I’m not going to overanalyse this. My own view is
that performance by league is volatile and a few people are still licking their
wounds from dropping League Two Aways this season and looking at the results, I
can see why!
In terms of Homes and Aways, I think I’ve covered this
before that Away bets have a higher ROI and therefore, are the most profitable
bets long-term but given the higher average odds, there is more volatility in
these bets. What is interesting is that the Home bets last season had a
nightmare season overall on the combined systems but they actually started the season very well and
helped to minimise the system losses as Aways created a massive hole early on
in the season.
As the season progressed, the returns switched and Homes went from being profitable to being loss making on these systems. Again, it’s a little surprising that Homes were loss making in a season when the Underlying results were favourable for Homes but it is due to the type of Home bets that were profitable. Odds on homes were very profitable but the bigger value homes (odds of 2.50+) were badly loss making and it’s these home bets that tend to make their way onto my ratings fairly often and therefore, I didn’t catch as many odds on Home winners as I would have liked.
As the season progressed, the returns switched and Homes went from being profitable to being loss making on these systems. Again, it’s a little surprising that Homes were loss making in a season when the Underlying results were favourable for Homes but it is due to the type of Home bets that were profitable. Odds on homes were very profitable but the bigger value homes (odds of 2.50+) were badly loss making and it’s these home bets that tend to make their way onto my ratings fairly often and therefore, I didn’t catch as many odds on Home winners as I would have liked.
I think the way to end these season reviews is to show
the overall live results, the betting banks for next season and the targets
that the systems will be aiming for next season. Here are these numbers for the
Established Systems:

A lot to take in here but I think it’s interesting to
concentrate on the relationship between ROI and ROC. As I’ve discussed lots of
times now, ROI is not as important as ROC and I think as time is going on, we
are seeing that more and more with these systems. System 6-21 has the lowest
ROI out of the 6 combined systems but has the highest ROC achieved per season.
I think the impact of this season is also now seen on the returns on systems
7-21 thru to 8-22 as well as systems 7 and 8. The target ROC for all 6 of these
systems next season is only 14% on average which basically puts these systems
at the lowest end of the target ROC for next season out of all my systems. I think unfortunately,
unless we see a massive upturn in performance next season, these higher
combined systems aren’t worth tracking any longer even though they have a very
good ROI. They don’t have enough bets to generate enough of a ROC. In other words, they carry too much risk for not enough return.
Overall then, I think that completes the review of the
Established Systems this season. A lot to take in and ponder here and probably
worth reading through the results and making your own observations if you are
going to use these systems next season.
In summary:
• Algorithms
one and two were profitable again for the 4th season in a row although returns
were lower than previous seasons due to more difficult underlying results
• The
filtering on algorithm one didn’t work well from system 6 to system 7 and
created the losses on systems 8 as well as the issues on systems 7-21 thru to
8-22
• A
higher than expected number of draws on system 7 was basically to blame for the
underperformance of the Established Systems this season
• The
combined systems did appear to improve on the single system results again
although it is debatable about how much value cross referring the algorithms
created
• The
value ratings have been useful in the sense we can clearly identify the fact
that the lower value bets on each algorithm were loss making last season and
have created no profits over 4 seasons now
• Filtering
the systems doesn’t work as well as the value ratings and using both the
filtering and the value ratings doesn’t leave too many bets on the systems, so
it points to using the value ratings as a way to filter the bets on the algorithms rather than using the systems to filter the bets
• It is
fair to assume that removing low value bets from the combined systems would
also improve their results although filtering the systems and using the ratings
isn’t going to leave too many bets to follow!
• Performance
by league last season has highlighted how difficult it is to draw conclusions from small datasets and whereas League Two aways were loss making before this season, that is no
longer the case
• Homes
underperformed over the season even though it was ‘easier’ to make money
backing Homes this season – the profits were due to odds on bets being very
profitable but my ratings tend to exclude many of these low bets
No comments:
Post a Comment